Over the past 24 hours, the price of the cryptocurrency XRP has seen a significant decline of up to 13%, with the current trading price at $2.30 as of December 5. This is in stark contrast to the performance of Bitcoin (BTC) , where the king of cryptocurrencies broke the $100,000 mark to set a new all-time high.
Specifically, the downward trend of XRP price started on December 3, resulting in a total loss of about 25% compared to the multi-year high of $2.90. The consequences of this situation not only directly affected the value of XRP but also caused the market capitalization of this coin to decrease by 8% in the same period, falling to $133 billion, forcing XRP to fall to the fourth position in the rankings after Tether USD (USDT).
XRP Gives Up All December Gains Against Bitcoin
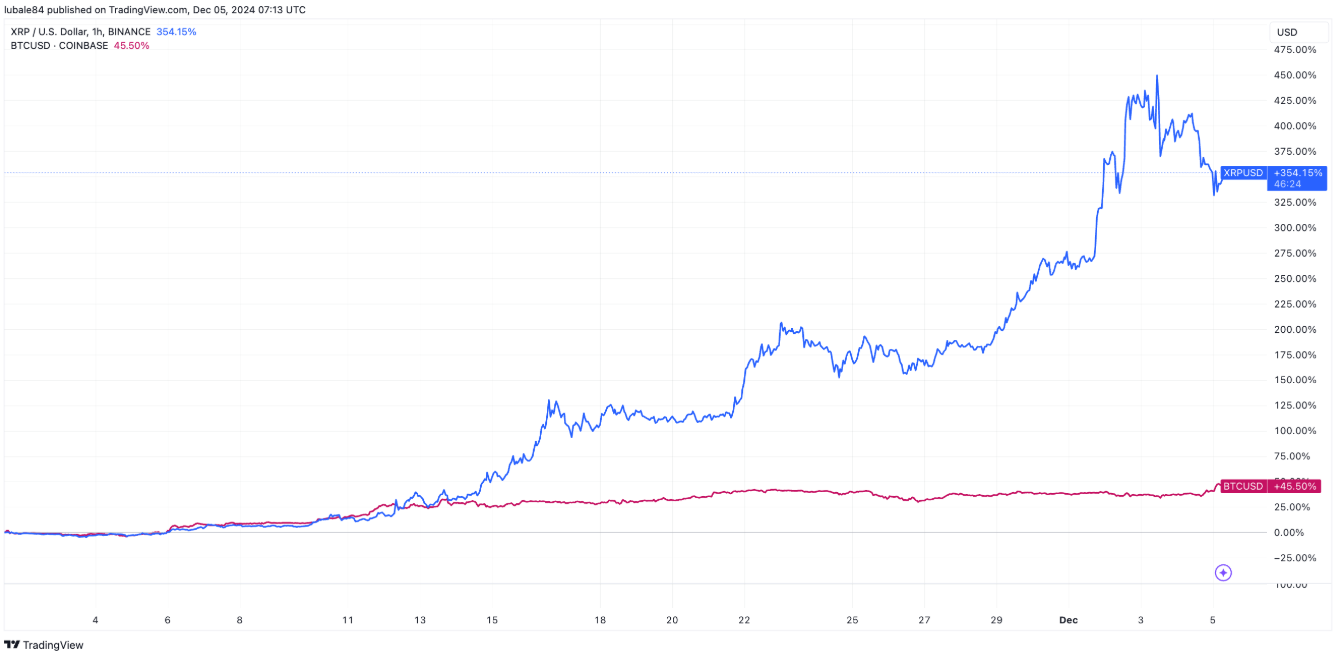
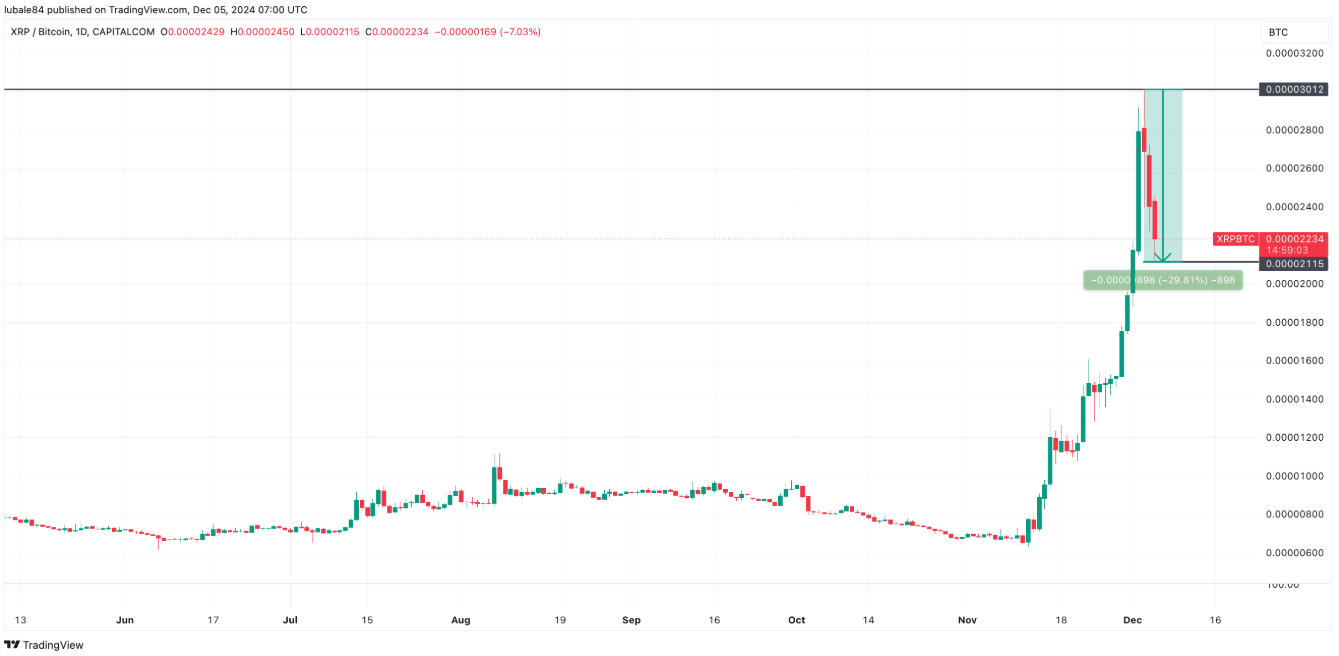
From the beginning of November to December 5, XRP saw an impressive 354% increase in value, which actually outpaced Bitcoin’s more modest 45.5% increase over the same period. Notably, on December 3, the XRP-to-Bitcoin exchange rate reached its highest point in 3.5 years, at 0.00003012. This increase was largely driven by strong network activity as well as positive sentiment in the market.

However, the ratio dropped to 0.00002334 on December 5, wiping out all the gains made between December 1 and 3. XRP’s decline came as Bitcoin broke its historic $100,000 mark, reaching a new high of around $104,000. At the same time, over $12.8 million in XRP long positions were liquidated on December 5, compared to $7 million in short positions, according to data from CoinGlass. This contributed to significant downward pressure on the price.

Additionally, open interest (OI) on XRP futures dropped from $4.3 billion to $4.2 billion within a day, but is still much higher than the $722 million level in early November. Meanwhile, XRP’s 8-hour funding rate increased from 0.0163% to 0.0553%, indicating that traders remain bullish on the altcoin.
Positive signal of the “bull flag” pattern.
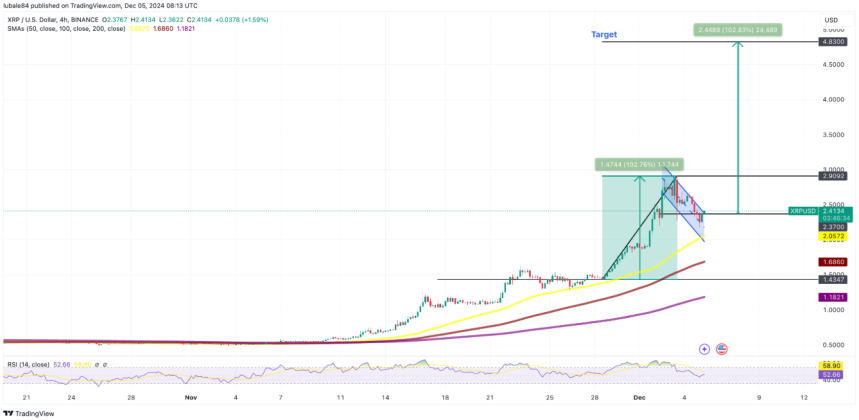
Technically, the XRP price chart is forming a “bull flag” pattern on the 4-hour time frame. This is a bullish continuation pattern that forms when the price moves sideways in a slightly decreasing range after a strong rally.
If the price closes above the pattern’s upper trendline at $2.37, the next target would be $4.83, marking a new all-time high. However, XRP’s relative strength index (RSI) has seen a decline, falling from an overbought level of 82 to 52 between December 3 and 5. If the RSI continues to decline, the price could potentially correct further.

In the event that the price fails to sustain at $2.37, XRP may have to retest the lower trendline of the pattern, currently at $2.05, which is supported by the 50-period simple moving average (SMA). If the situation deteriorates further, the next support level would be at the 100-period SMA, around $1.68. This analysis suggests that, although XRP is facing strong selling pressure, the long-term upside potential still has room to grow and has not been completely eliminated.


