Over the past 30 days, Ripple (XRP) has seen the most impressive gains among the top 10 cryptocurrencies, gaining 333%. However, the latest indicators are suggesting that this growth momentum may be starting to slow down.
Currently, XRP’s RSI is at 47.9, reflecting a neutral signal after breaking out into overbought territory. In addition, the Chaikin Money Flow (CMF) Index has turned negative, indicating an increase in selling pressure, which is likely to warn that the price will continue to trend down in the near future.
XRP RSI is currently neutral
Ripple ‘s RSI is currently at 47.9, down significantly from levels above 70 from December 2 to 3. Typically, an RSI above 70 indicates that an asset is overbought, which means a correction or price decline is likely. The RSI’s drop below 70 suggests that XRP is no longer overbought, and the recent decline may reflect a loss of bullish momentum that has been driving prices higher.

The Relative Strength Index (RSI) is an oscillator that measures the speed and magnitude of price changes. It ranges from 0 to 100, with values above 70 indicating overbought conditions, while values below 30 indicate oversold conditions.
When the RSI of XRP drops below 70, this could indicate that its recent bullish momentum is coming to an end. If the RSI continues to decline, this could mean that the XRP price will continue to decline, with the possibility of the price encountering more resistance as the bullish momentum becomes weaker.
Ripple CMF Turns Negative After 6 Days
XRP’s CMF index has dropped to -0.10, after remaining positive from November 29 to December 5. The move into negative territory indicates increased selling pressure, as the CMF measures the flow of money into and out of the asset.

The CMF indicator is indicating that money is being withdrawn from assets more than it is being invested in, which can be a negative signal for prices. The CMF is an analytical tool that combines price and volume to measure buying and selling pressure over a given period of time. The indicator ranges from -1 to +1, with positive values reflecting accumulation (buying pressure) and negative values representing distribution (selling pressure).
Currently, XRP’s CMF is at -0.10, its lowest level since November 21, indicating that the overall market sentiment is turning negative. With this negative CMF value, it could signal the bearish pressure XRP is facing in the short term, meaning that the asset may struggle to maintain its value or even be at risk of further decline.
Ripple Price Prediction: Will XRP Drop Below $2 in December?
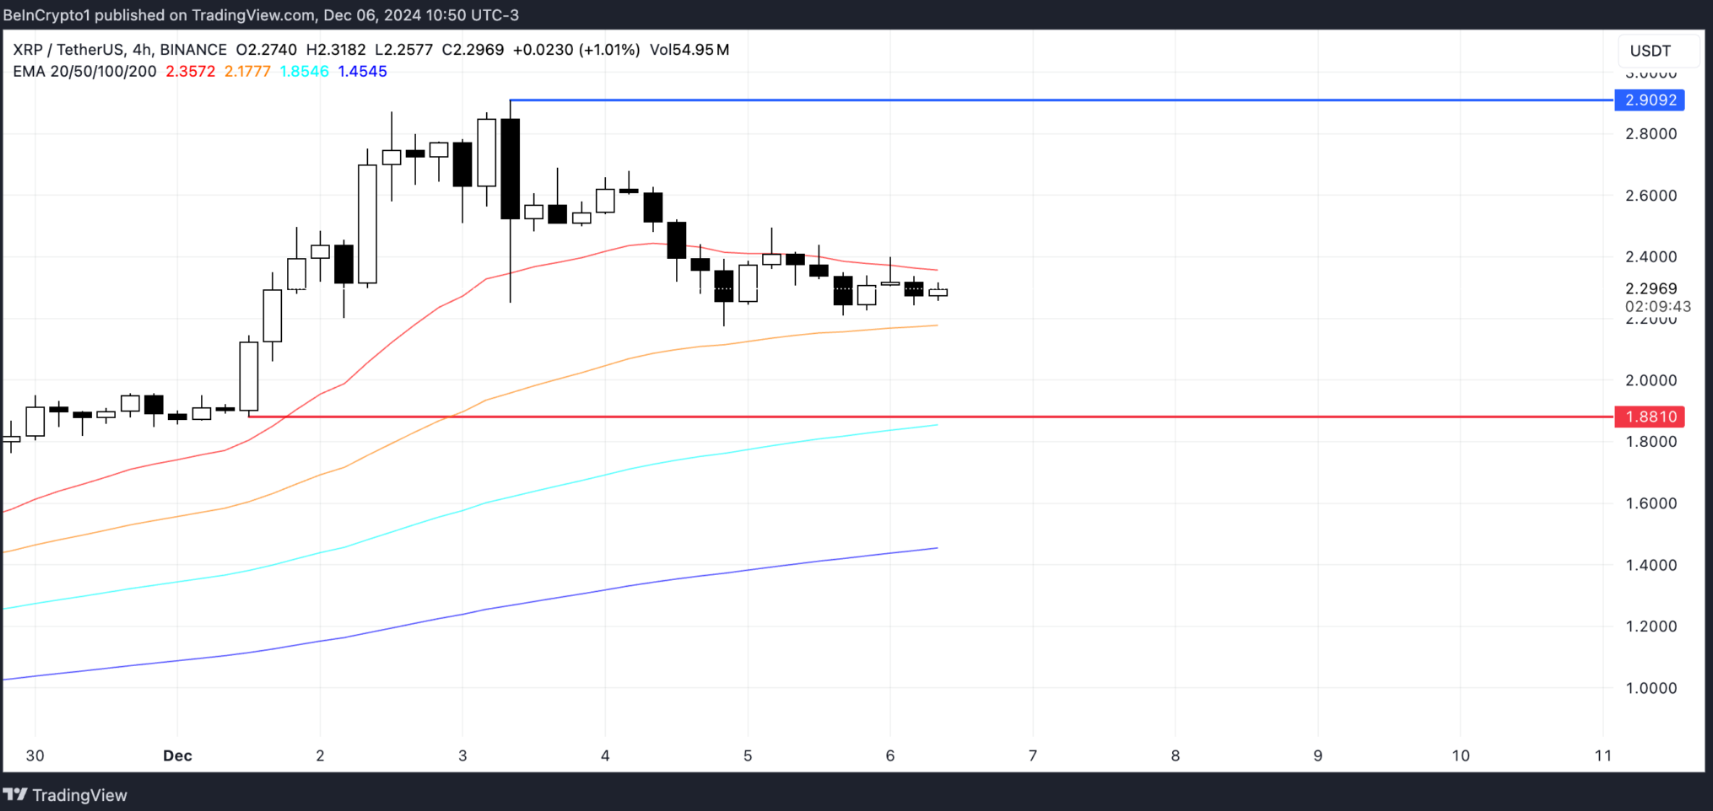
Ripple’s EMAs show that the short-term ones are now above the long-term ones, signaling an overall bullish outlook. However, XRP price is currently trading below the shortest EMA, which could signal the start of a bearish trend.

If this trend continues, XRP price could face downward pressure, approaching the $1.88 support level. Conversely, if the downtrend is avoided and the uptrend is resumed, Ripple price could rise to test the $2.90 resistance level. If this resistance level is broken, XRP could potentially grow further, with the next level of interest at $3.
This article is for informational purposes only and is not investment advice. Investors should do their own research before making any investment decisions. We are not responsible for your investment decisions.


