Technical Analysis December 5: BTC , ETH , XRP , SOL , BNB , DOGE , ADA , AVAX , TON , SHIB shows that the entire crypto market is going through a pretty impressive period. Bitcoin ( BTC ) has been consolidating near the $100,000 level for the past few weeks, while other altcoins have also recorded positive developments. Let’s take a deeper look at what’s going on with these top 10 cryptocurrencies.
Technical Analysis December 5
Bitcoin (BTC)
Data shows that every small dip in Bitcoin ( BTC ) is being bought in. According to SoSoValue, Bitcoin ETFs in the United States saw $676 million in inflows on December 3. Capriole Investments founder Charles Edwards said in a post on X that institutional demand for Bitcoin has skyrocketed, leading to 13.5% of all Bitcoin being held by institutions and ETFs.
Symmetrical Triangle Pattern – Indecision Between Bulls and Bears
Bitcoin has formed a symmetrical triangle pattern, indicating indecision between bulls (buyers) and bears (sellers). The upsloping 20-day exponential moving average ($92,992) and the relative strength index (RSI) in the positive zone suggest that bulls have the upper hand.
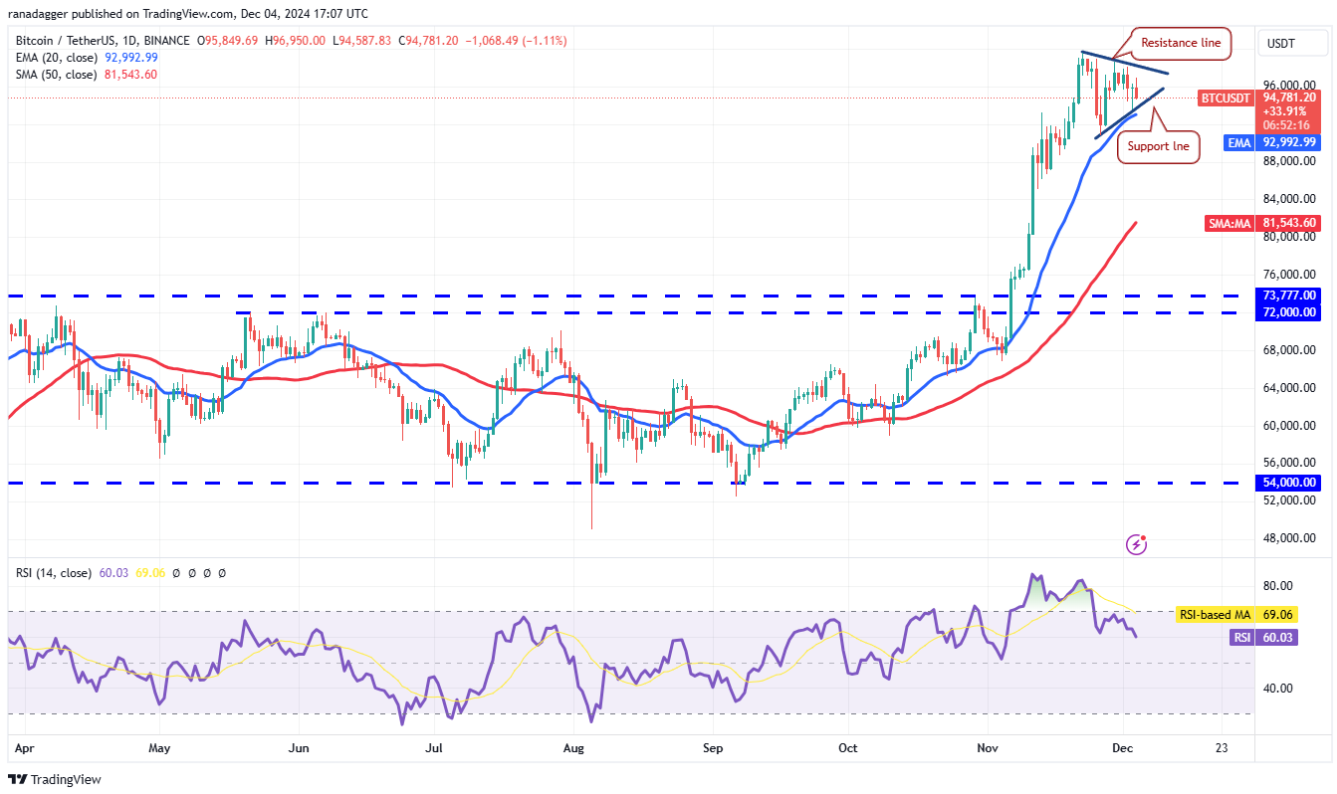
A breakout and close above the triangle increases the possibility of a rally above $100,000. The BTC/USDT pair could rise to $113,331 and then $125,000. However, traders should be cautious as repeated failures to break above the key resistance level could prompt short-term traders to book profits, causing a rapid decline.
Bearish Scenario – The Decline Could Be Prolonged
The advantage will tilt to the bears if the price breaks and closes below the triangle. That could start a decline to $90,000 and then $85,000. If the supports break, the decline could extend to the 50-day simple moving average ($81,543).
Conclusion about BTC
Consolidation near key resistance levels above usually resolves to the upside. However, traders should be aware of the possibility of a decline if the symmetrical triangle pattern breaks down. Whether Bitcoin ’s consolidation will resolve to the upside or downside remains to be seen.
Ethereum (ETH)
Ether ( ETH ) bounced from the downtrend line on December 3, suggesting that the bulls are attempting to flip this level into support. The upsloping moving averages and the RSI near the overbought zone suggest that the path of least resistance is to the upside.
Bullish Scenario – The Upside Could Take ETH to $4,094
The ETH/USDT pair could rise to $4,000 and then $4,094. Buyers are expected to face strong selling pressure at $4,094. This bullish view will be negated in the near term if the price declines and breaks below the 20-day EMA ($3,436). Such a move will signal a lack of demand at higher levels.
Bearish Scenario – The decline could extend to 50-day SMA
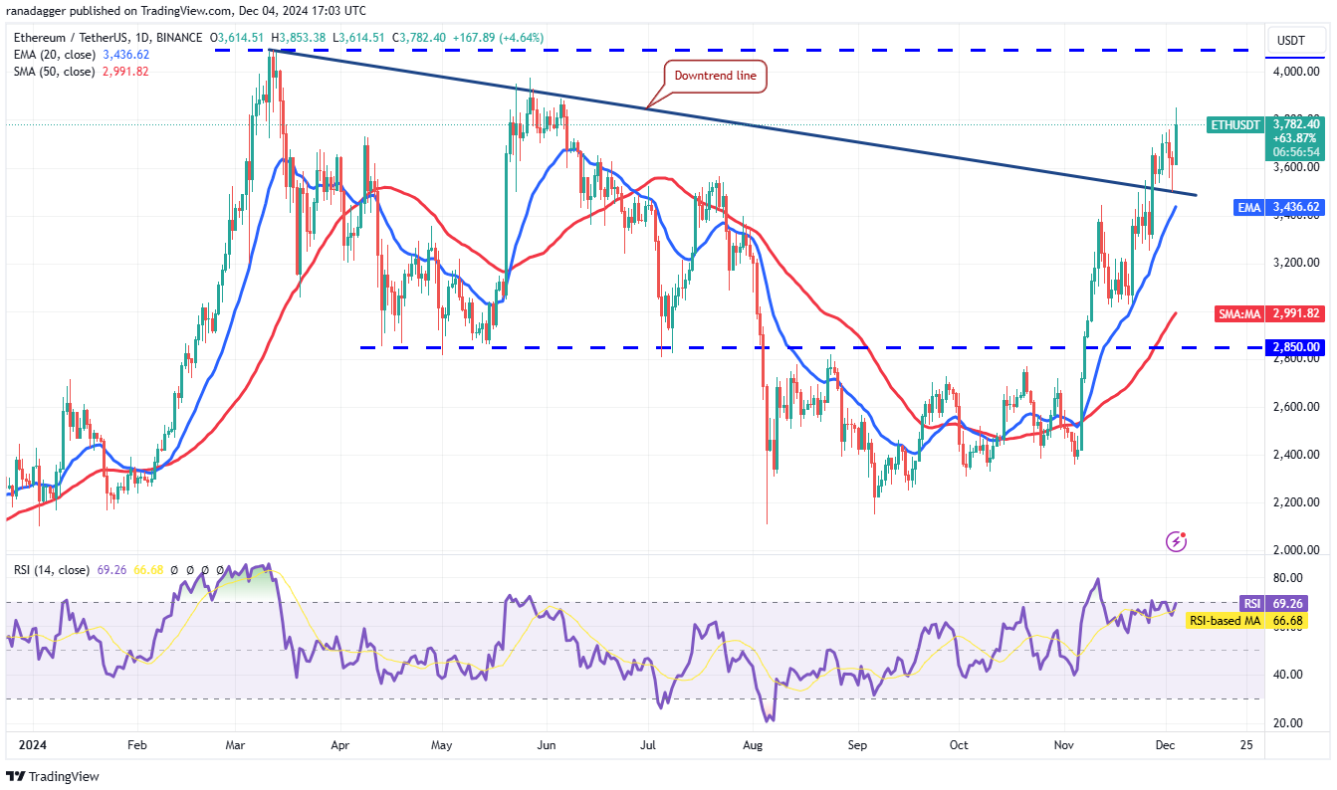
The pair could then drop to the 50-day SMA ($2,991). This would suggest that Ether ( ETH ) lacks demand at higher levels and bears are in control.
Conclusion on ETH
Overall, the bullish momentum of Ether ( ETH ) is consolidating and the bulls are attempting to reverse the downtrend line. However, traders need to keep a close eye on price action around key resistance levels, as breaks of these could lead to an extended decline.
XRP
XRP ( XRP ) has been on a strong uptrend, but the rally stalled at $2.91 on December 3, suggesting that the bulls are booking profits.
Recovery Scenario – Upside Opportunity to $3.84
The first support on the downside is the 38.2% Fibonacci retracement level at $2.28. If the price rebounds from this support, the bulls will make one more attempt to resume the uptrend by pushing the XRP/USDT pair above $2.91. If they can do so, the pair could surge to $3.84.
Bearish Scenario – Risk to 61.8% Fib Retracement Level at $1.90
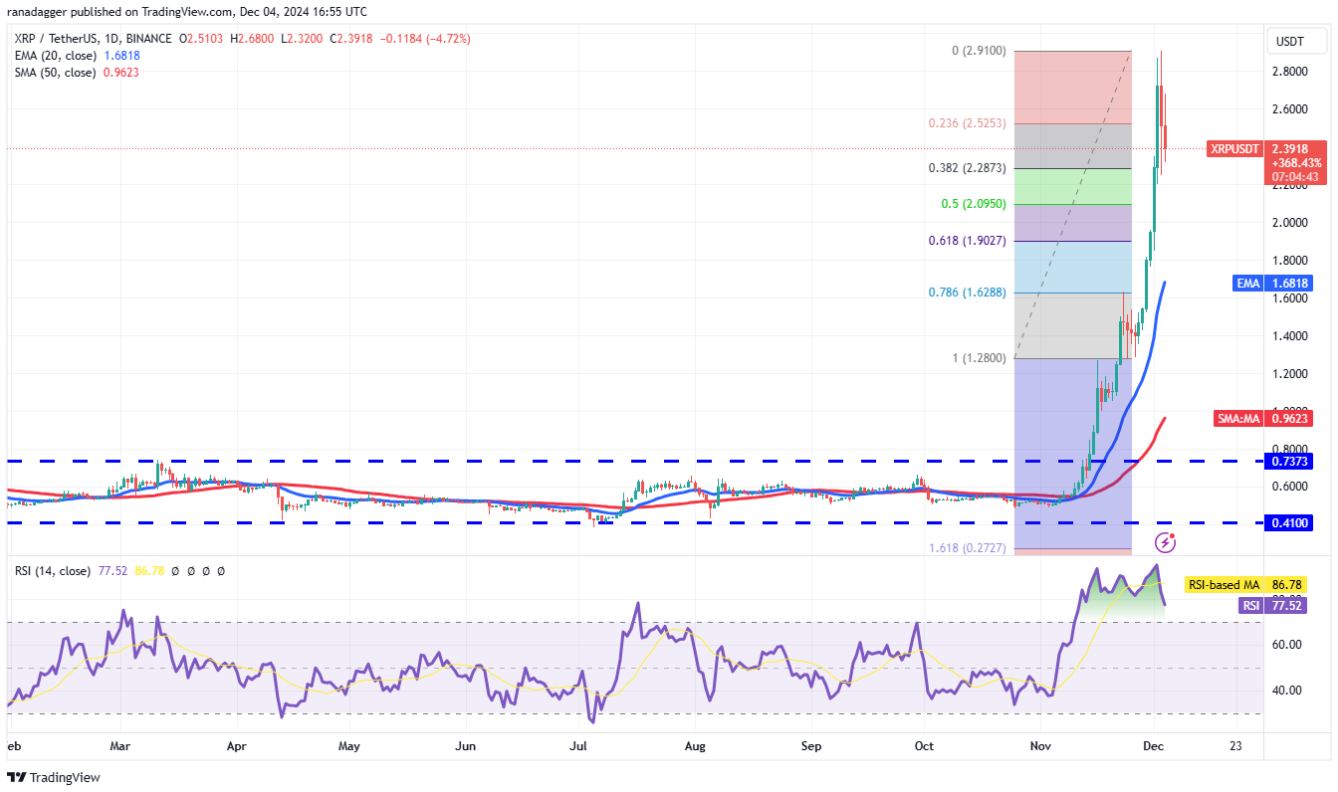
Contrary to this assumption, if the $2.28 support level is broken, the pair could drop to the 50% Fib retracement level of $2.09 and then to the 61.8% Fib retracement level of $1.90. A deeper pullback could delay the start of the next leg of the uptrend.
Conclusion on XRP
XRP ’s rally stalled at $2.91, suggesting that the bulls are taking profits. A bounce from the $2.28 support would be a positive sign, opening the door for a rally to $3.84. However, if this support level breaks, the pair could face further downside pressure.
Solana ( SUN)
Solana ( SOL ) rallied from $215 on December 3, showing that the bulls are aggressively defending the breakout level at $210.
Breakout Scenario – Opportunity to Rise to $300
The 20-day EMA ($230) has flattened out and the RSI is just above the midpoint, suggesting a possible range formation in the near term. The SOL/USDT pair could fluctuate between $210 and $248 for a few days. A breakout and close above $248 could open the doors for a rally to $264. The bears are expected to defend $264 with all their might as a rally above this level could push the pair to $300.
Bearish scenario – Risk to 50-day SMA ($202)
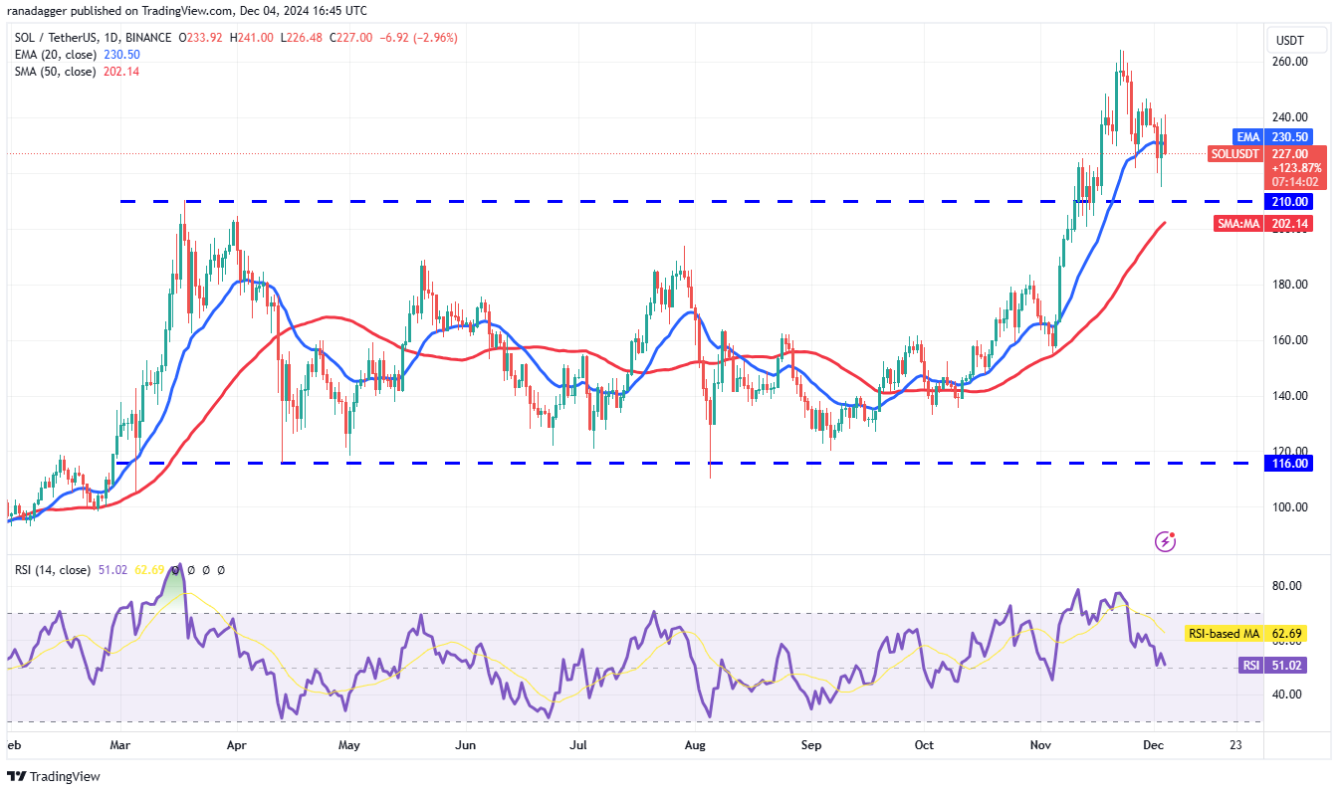
On the downside, a slide below the 50-day SMA ($202) will suggest that bears are in control.
Conclusion on SOL
Solana ( SOL ) is being defended by the bulls at $210, which shows that they are determined to maintain the upward momentum. If the SOL/USDT pair breaks above $248, the rally could continue to $264 and $300. However, a breakdown below the 50-day SMA will suggest that the bears are regaining control.
BNB
BNB ( BNB ) surged from the 50-day SMA ($615) on December 3 and surged above the $722 resistance.
Bullish Scenario – Chance of Rise to $810
The bears will try to pull the price below $722, while the bulls will try to defend this level. If the price rebounds from $722, it will signal that the bulls are in control. That increases the possibility of a rally to the pattern target of $810.
Bearish scenario – Risk to 20-day EMA ($654)
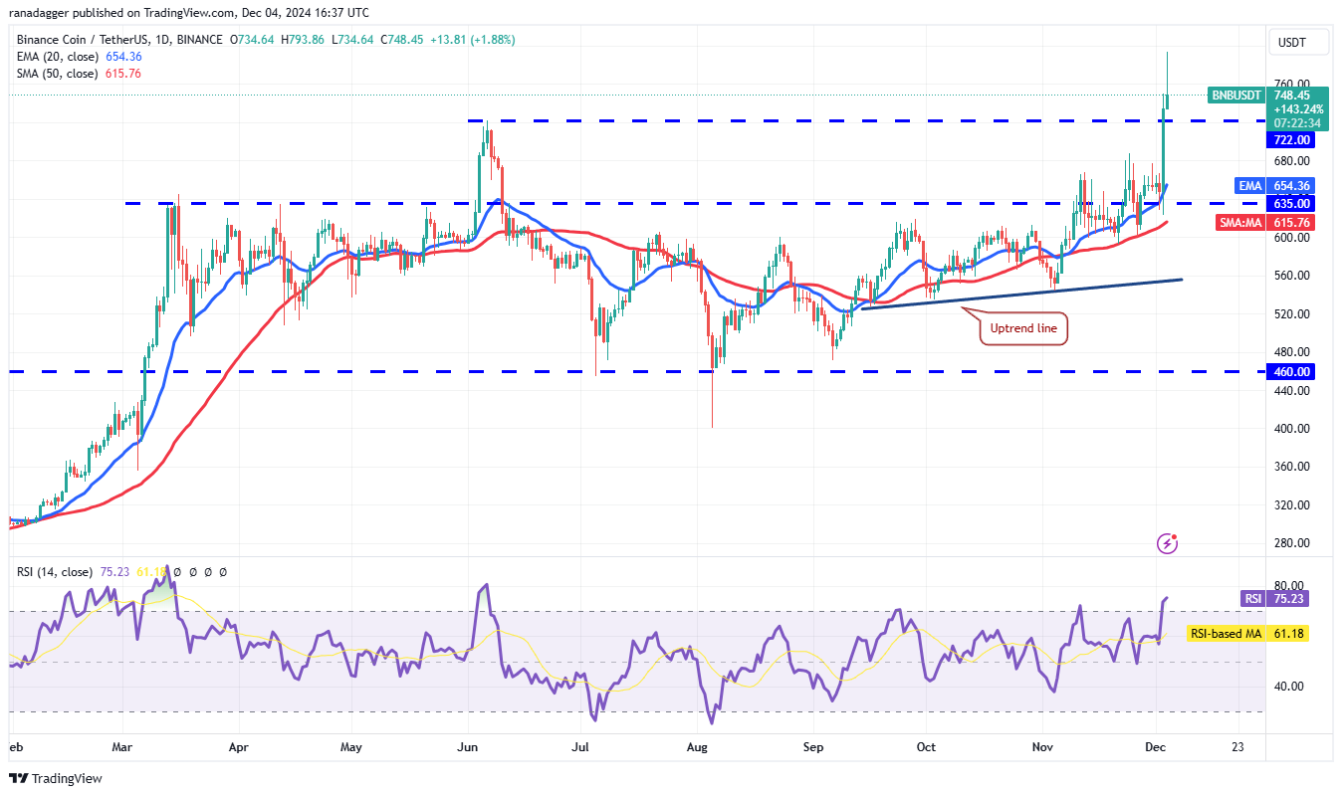
Instead, if the price declines and breaks below $722, it will suggest that bears are active at higher levels. The BNB/USDT pair could slide to $680 and then to the 20-day EMA ($654).
Conclusion about BNB
BNB ( BNB ) has surged above the $722 resistance, suggesting that bulls are in control. If the price rebounds from $722, the upside momentum could continue towards the $810 target. However, a break below $722 will increase the risk of a drop to the 20-day EMA ($654).
Dogecoin (DOGE)
Dogecoin ( DOGE ) rebounded from the support line of an ascending channel pattern on December 3, signaling buying at lower levels.
The upward sloping moving averages and the RSI in the positive zone suggest that the bulls are in command. Buyers will try to push the price towards the resistance level of the range, where the bears are likely to step in.
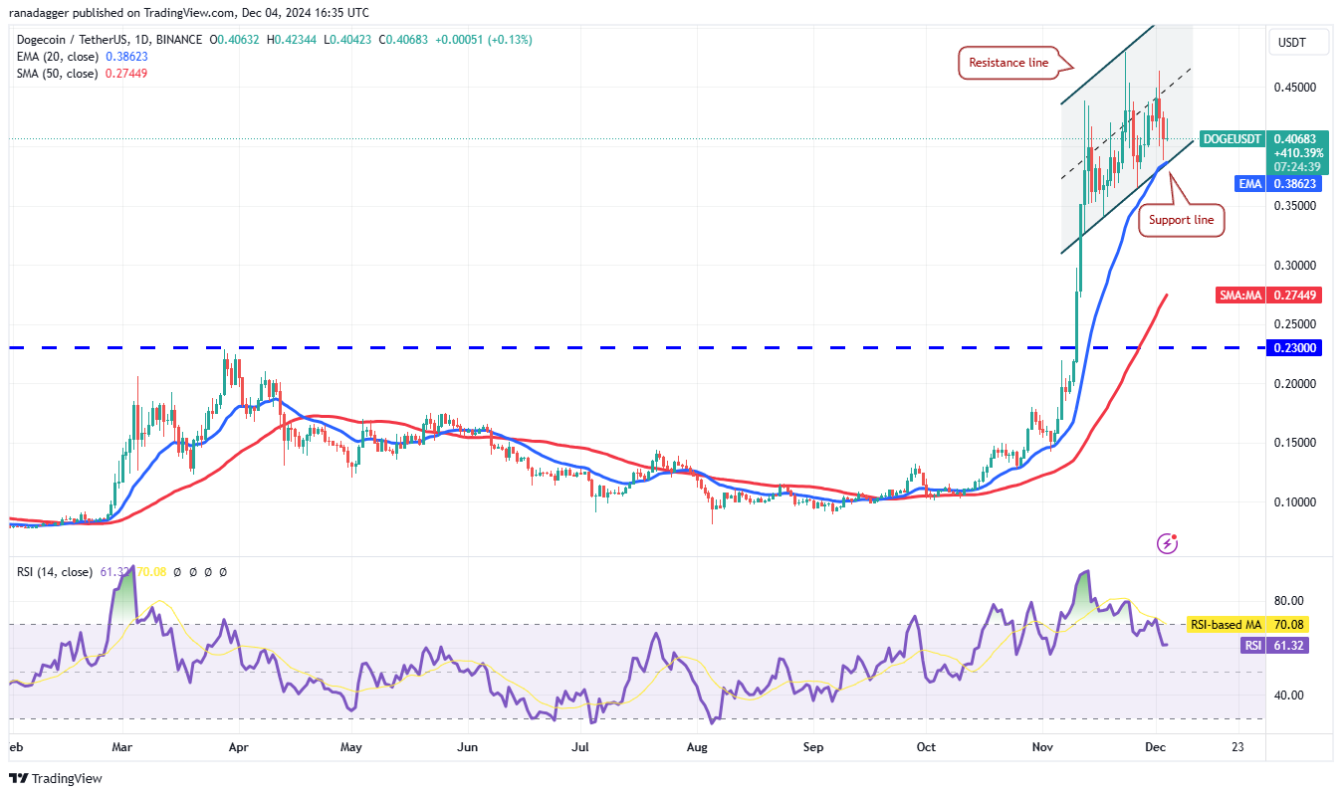
If the recovery fails to sustain, it would suggest that bears are selling on minor rallies. That increases the risk of a break below the channel support line. If that happens, the DOGE/USDT pair could slide to $0.33 and then to the 50-day SMA ($0.27).
THERE IS
Cardano (ADA)’s long candle wick on December 3 shows that bears sold aggressively on the rally to $1.25.
A positive sign in favor of the bulls is that they are not giving up much ground to the bears. This shows that the bulls expect the rally to continue. If the price breaks out above $1.33, the ADA/USDT pair could surge to $1.50.
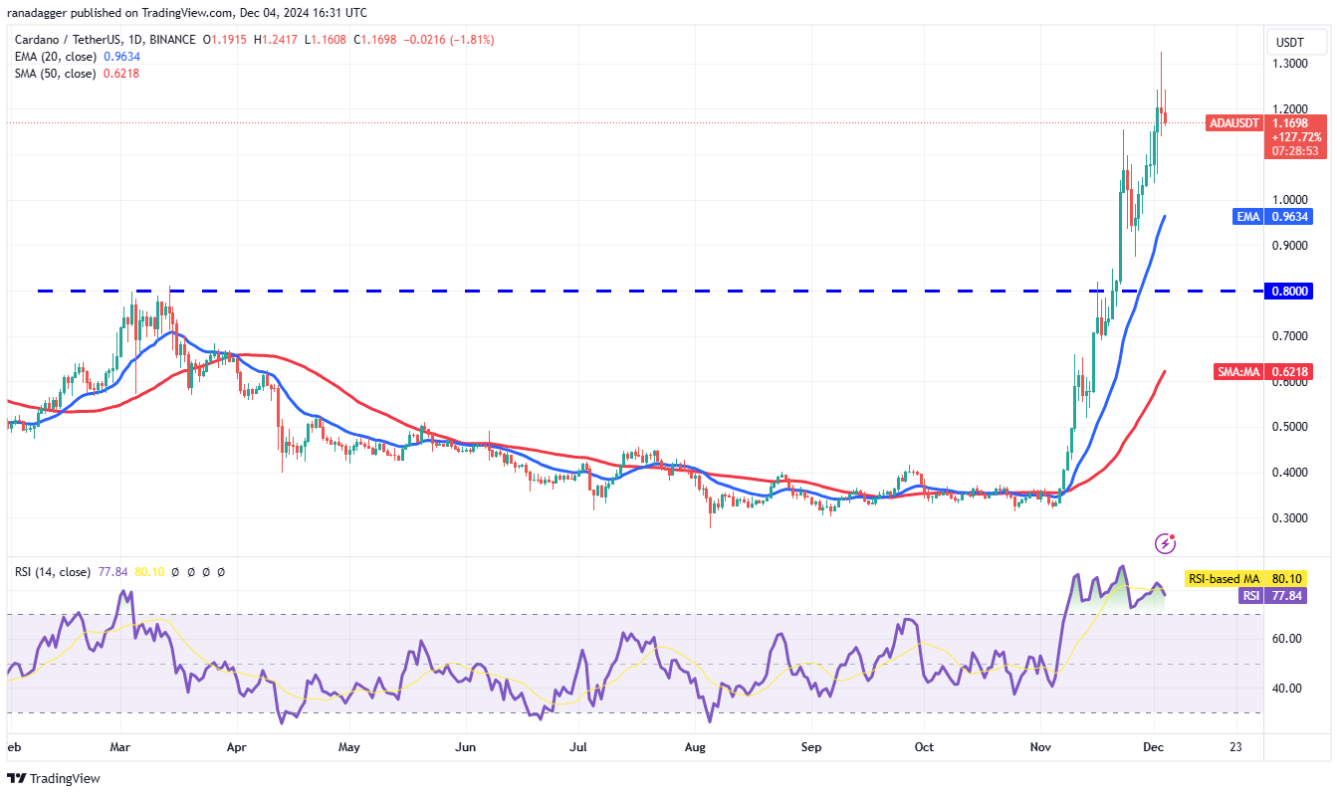
Conversely, if the price declines and breaks below $1.14, it will signal that the bulls are losing control. The pair could revisit the 20-day EMA ($0.96), where the bulls and bears are likely to witness a tough battle.
AVAX
Avalanche (AVAX) surged above the overhead resistance at $51 on December 2, suggesting that bulls are in control.
The bears attempted to pull the price below $51 on December 3, but the bulls held firm. This suggests that the bulls are attempting to flip the $51 level into support. If successful, the AVAX/USDT pair could rally to $60 and then $65.
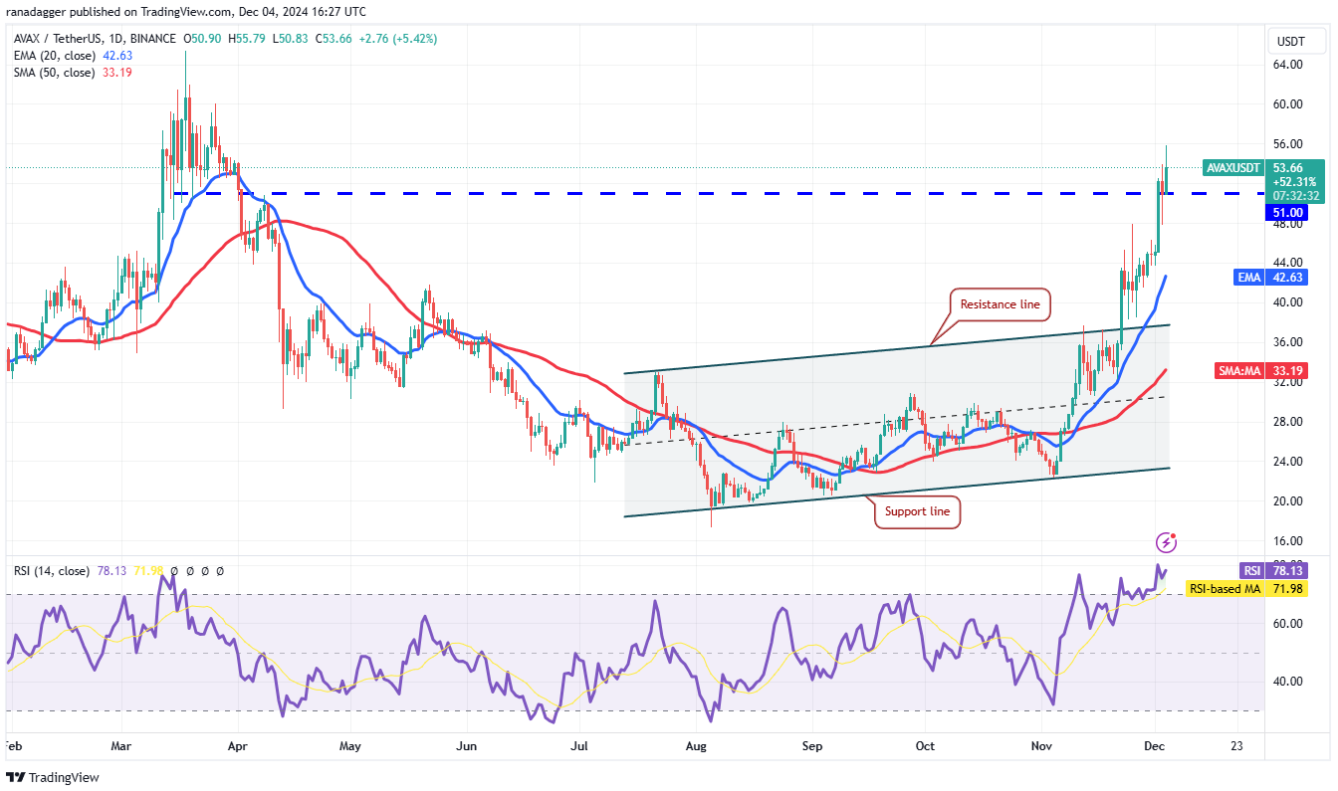
If the bulls want to stall the gains, they will have to quickly pull the price below $51. After that, the pair could drop to the 20-day EMA ($42.63), which is expected to act as a strong support.
Toncoin (TON)
Toncoin (TON) has started its journey towards the resistance in the large range between $4.44 and $8.29. The bears attempted to stall the gains by pulling the price down to the 20-day EMA ($6.19) on Dec. 3, but the bulls held firm. There is minor resistance at $7.65, but that is likely to be crossed. The TON/USDT pair could rise to $8.29, where the bears are expected to mount a strong defense once again.
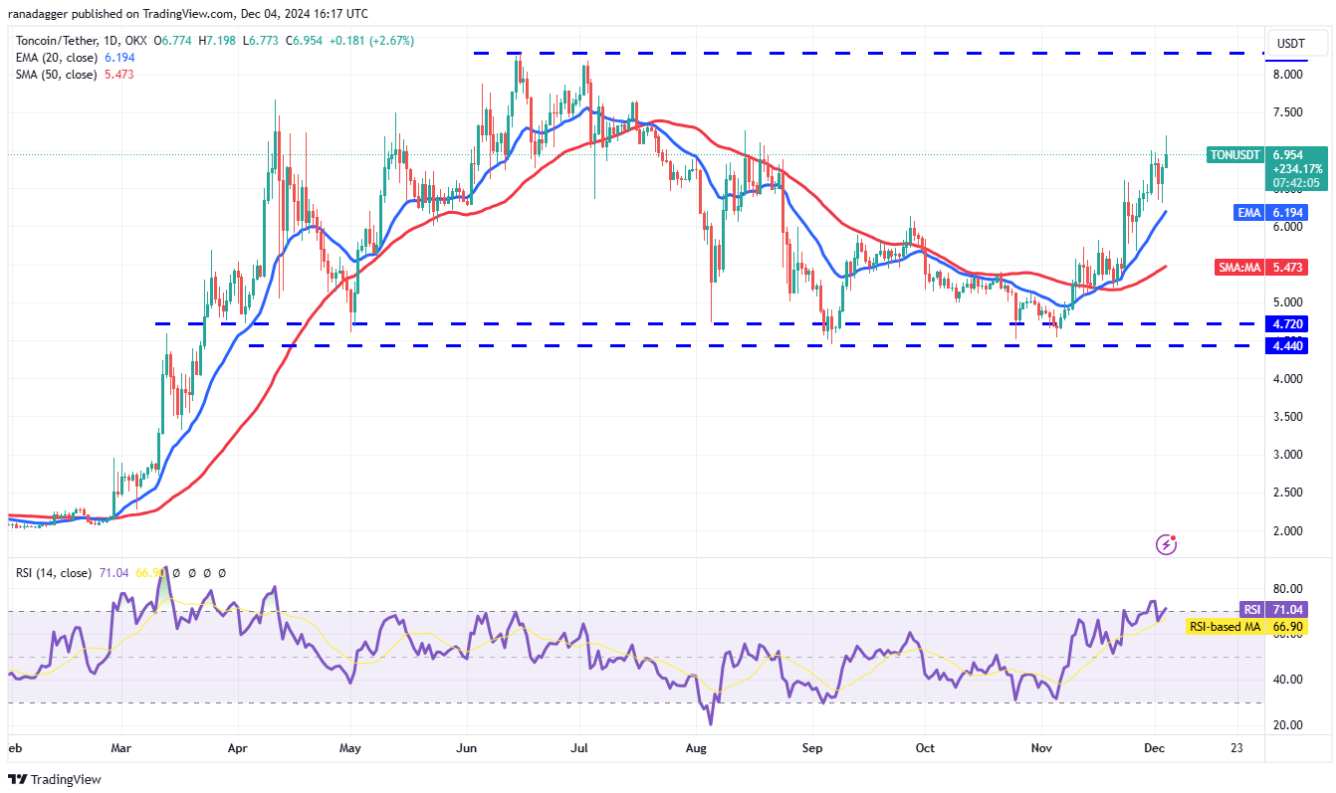
The 20-day EMA is an important support level to watch on the downside. A break and close below the 20-day EMA would indicate that bears are back in the game. The pair could then drop to the 50-day SMA ($5.47).
Shiba Inu (SHIB)
Shiba Inu (SHIB) successfully retested the breakout level from the symmetrical triangle pattern on December 3, indicating positive sentiment. There is a minor resistance at $0.000033. If buyers overcome this barrier, the SHIB/USDT pair could rise to $0.000039. The bears are expected to defend this level aggressively, but if the bulls prevail, the up move could extend to $0.000047.
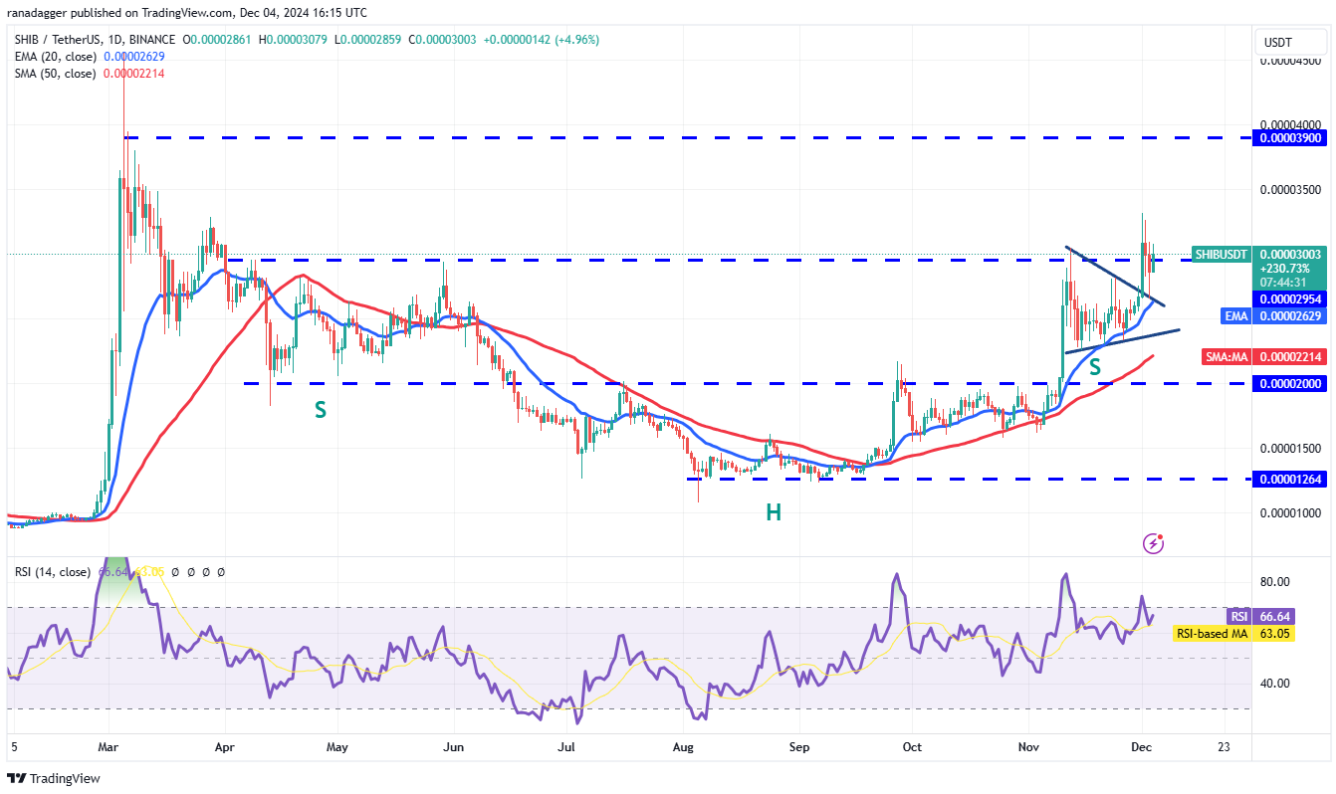
This bullish view will be invalidated in the near term if the price declines and breaks below the 20-day EMA ($0.000026). Such a move will suggest that the breakout above $0.000030 was a bull trap.
This article is for informational purposes only and is not investment advice. Investors should do their own research before making any investment decisions. We are not responsible for your investment decisions.


