Bitcoin (BTC) found support near $94,000 on December 10 and bulls started a solid recovery on December 11. BTC price surged back above the psychologically important $100,000 level after the November inflation report met economists’ expectations. According to the FedWatch Tool, the probability of a 25 basis point rate cut at the next meeting has increased to more than 96%. That could prove to be bullish for risk assets.
Technical analysis BTC, ETH, XRP, SOL, BNB, DOGE, ADA, AVAX, TON, SHIB on December 12.
Bitwise Chief Investment Officer Matt Hougan stated in a report that he believes Bitcoin will likely hit $200,000 by the end of 2025. In addition to Bitcoin, he is also bullish on Ether (ETH) and Solana (SOL), as he predicts their prices will reach $7,000 and $750, respectively.
Bitcoin’s strong rally is expected to face heavy selling near its all-time high of $104,088. Failure to clear the overhead barrier could attract another round of selling from investors in the short term. That suggests Bitcoin could remain volatile in the near term, leading to liquidation of leveraged positions. Will Bitcoin hold above $100,000 or will higher levels attract sellers? Can altcoins recover from the recent pullback? Let’s analyze the charts of the top 10 cryptocurrencies to find out.
BTC Technical Analysis
Bitcoin has rebounded strongly from the 20-day exponential moving average ($96,133), suggesting that the uptrend is still intact.
The bulls will have to push the BTC/USDT pair above the resistance zone between $101,351 and $104,088 to signal the continuation of the uptrend. After that, the pair could rise to $113,331 and then $125,000.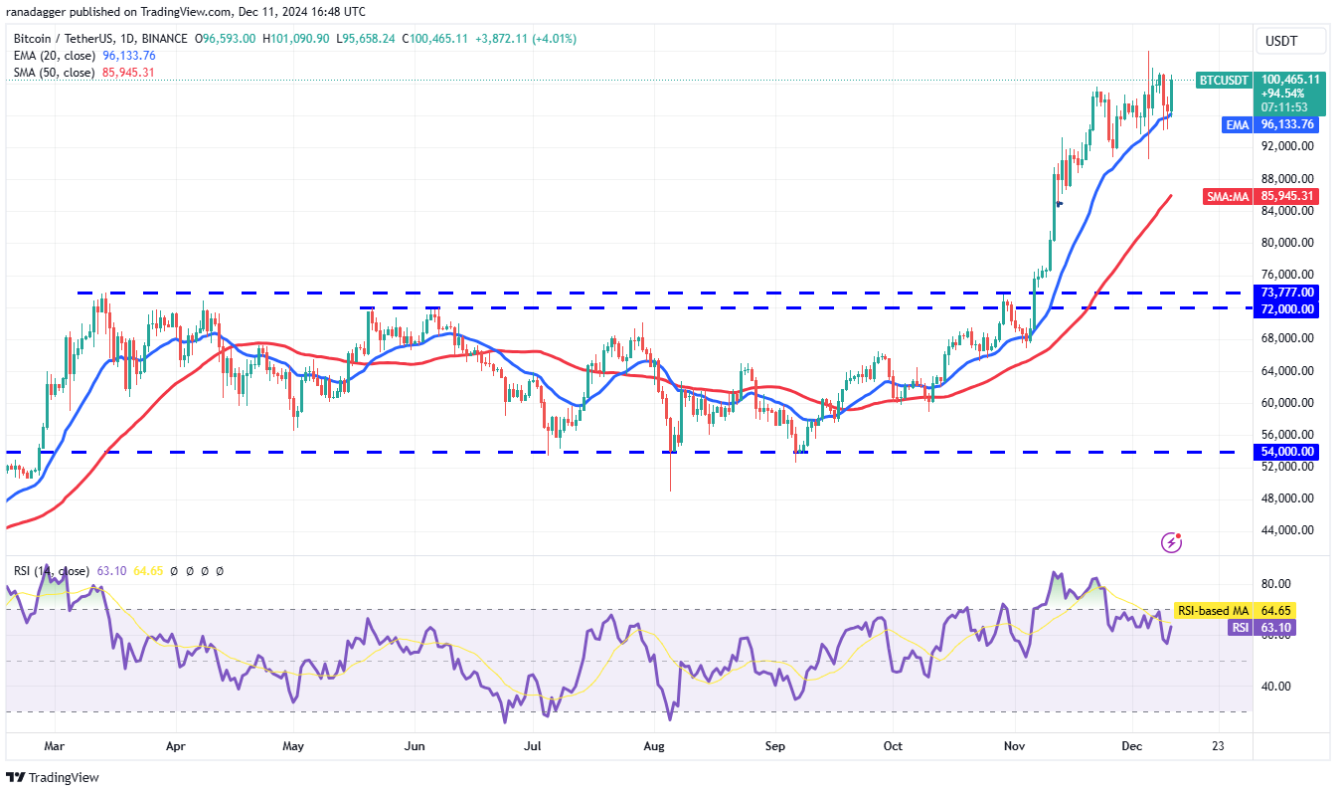
Contrary to this assumption, if the price declines and breaks below the 20-day EMA , this would indicate that the bulls are booking profits. The pair could drop to $90,000, an important support level to watch out for.
ETH Technical Analysis
Ether bounced off the downtrend line on December 10, suggesting that the bulls have turned this level into support. The bulls will attempt to push the price towards $4,000, but higher levels are likely to attract sellers. If the price turns down from the overhead resistance, it will indicate a possible range formation in the near term. The ETH/USDT pair may remain stuck between $4,000 and the downtrend line for some time.
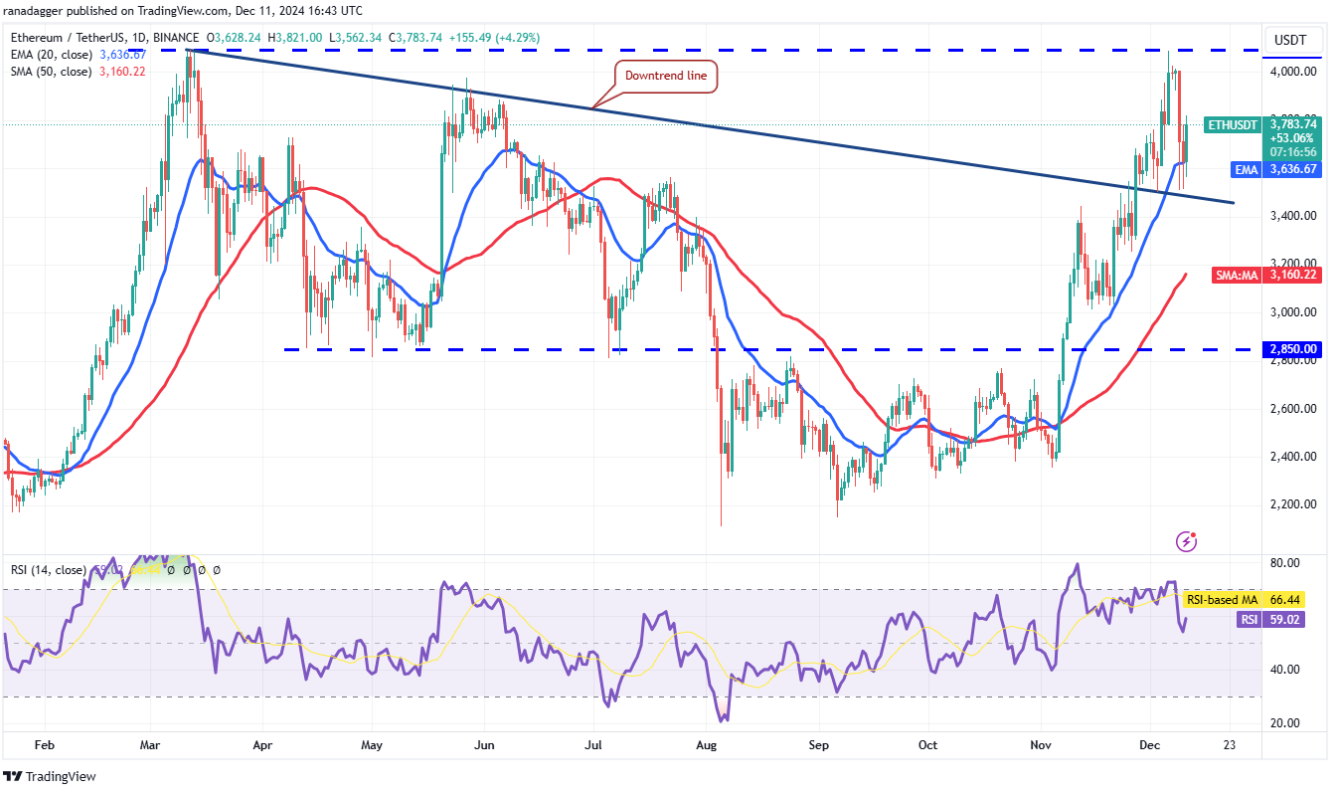
Breaking through and holding above $4,000 could open a new phase in the pair’s uptrend. There is a possibility that the price could reach $4,500. However, this bullish outlook would be negatively impacted if, in the near term, the price declines and breaks below the current downtrend line.
XRP Technical Analysis
XRP (XRP) is correcting within an uptrend. The pullback found support at the 61.8% Fibonacci retracement level of $1.90. The solid recovery from lower levels shows strong buying by the bulls. The XRP/USDT pair could reach $2.65 and then $2.91, where the bears will attempt to stall the recovery. If the price turns down sharply from the overhead resistance, the pair could enter a few days of consolidation.
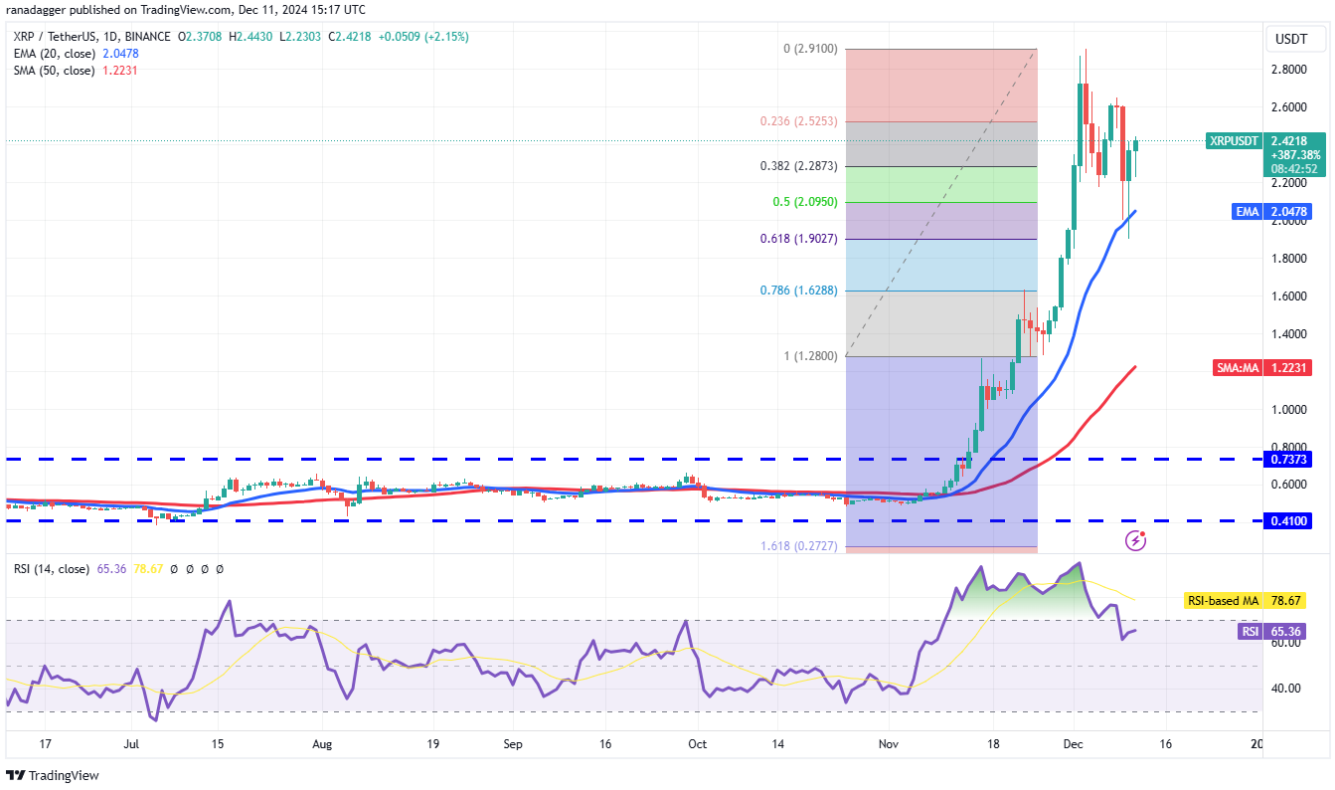
The next trend is likely to be formed when the price breaks above $2.91 or below $1.90. If the price breaks above $2.91, the pair could see a strong rally towards $3.50. Conversely, if the price falls below $1.90, the pair is likely to drop to the Fibonacci retracement level of $1.63, which represents a 78.6% drop.
SOL Technical Analysis
Solana has corrected inside a descending channel pattern, which shows that bears are selling on rallies.
The SOL/USDT pair has bounced off the channel support line, signaling solid buying pressure on dips. The relief rally is likely to face selling pressure at the 20-day EMA ($229) and then the resistance line. If the price turns down from the resistance above, the pair could remain inside the channel for some time.
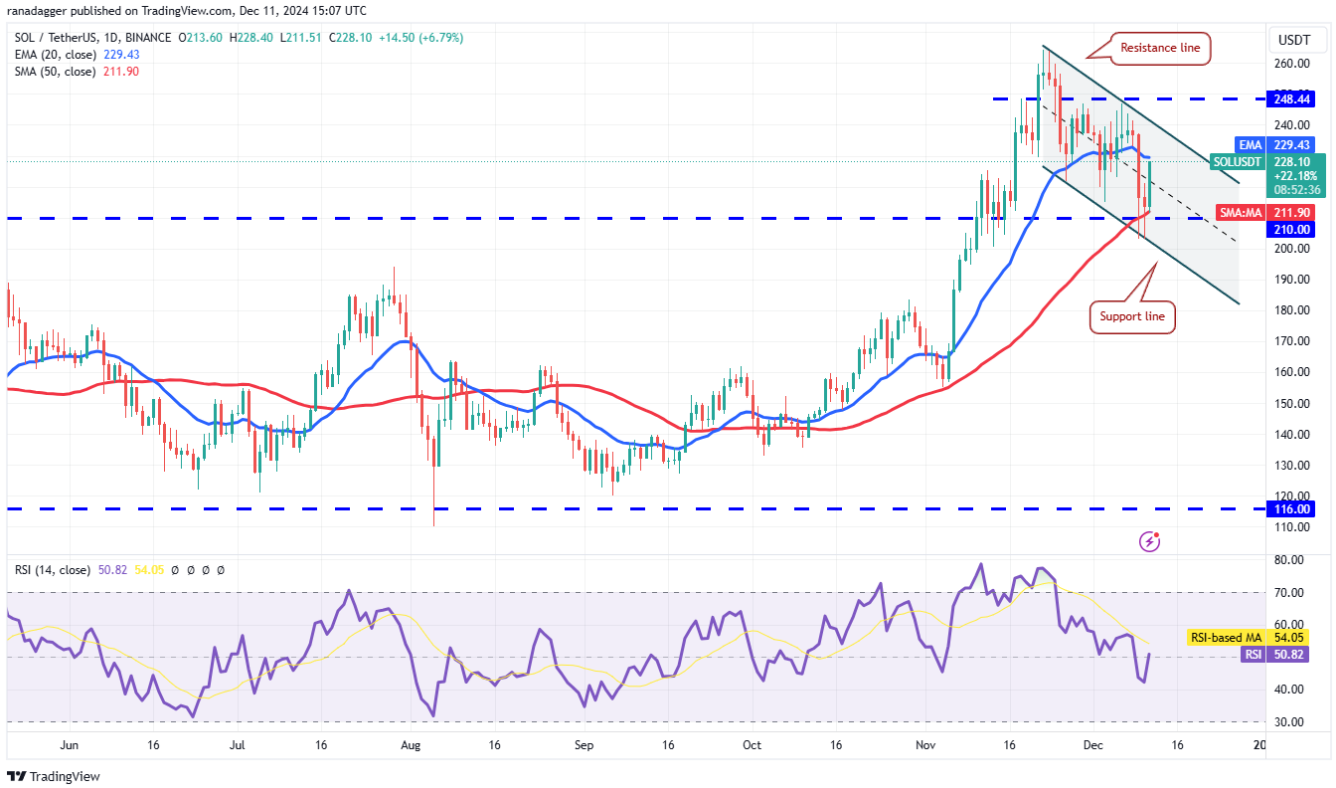
The next trending move is expected to start when the price breaks above or below the channel. If buyers push the price above the resistance line, the pair could surge to $248 and then $264.
BNB Technical Analysis
BNB (BNB) plunged below the breakout level of $722 and the 20-day EMA ($682) on December 9, indicating aggressive profit booking by the bulls. A small consolation for buyers is that the BNB/USDT pair bounced off the 50-day simple moving average ($631) and climbed back above the 20-day EMA. The bulls will now attempt to push the price to $722, where the bears are expected to mount a strong defense.
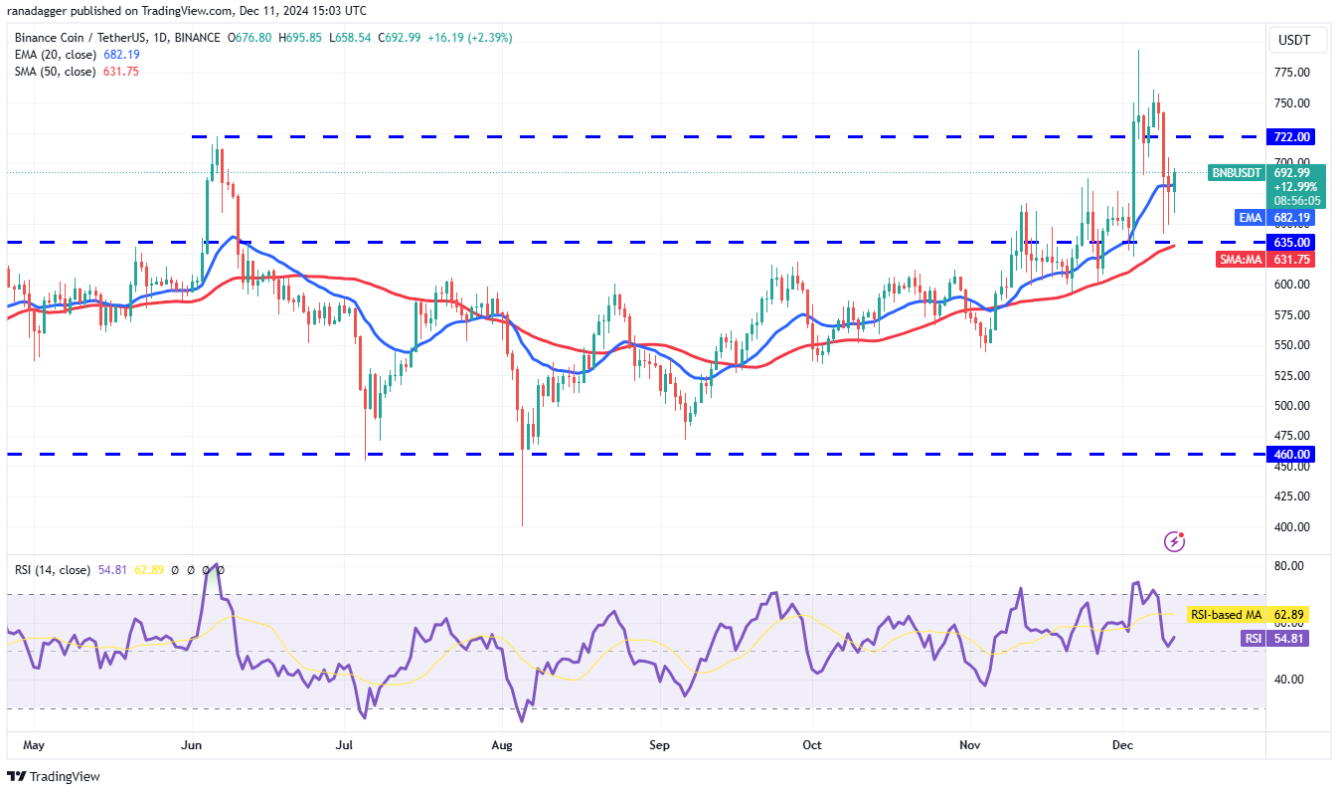
The 20-day EMA is currently flat, while the relative strength index (RSI) is just above its average. This suggests that a range-bound trading action is likely in the near term. The pair is expected to fluctuate between $722 and $635 over the next few days before starting to make a clear trend change.
DOGE Technical Analysis
Dogecoin (DOGE) broke and closed below the support line of an ascending channel pattern on December 10, but the bears are struggling to keep the price low. The bulls are attempting to push the price back into the channel. If successful, it will suggest that the breakdown could be a bear trap. The DOGE/USDT pair could rise to $0.42 and then $0.48.
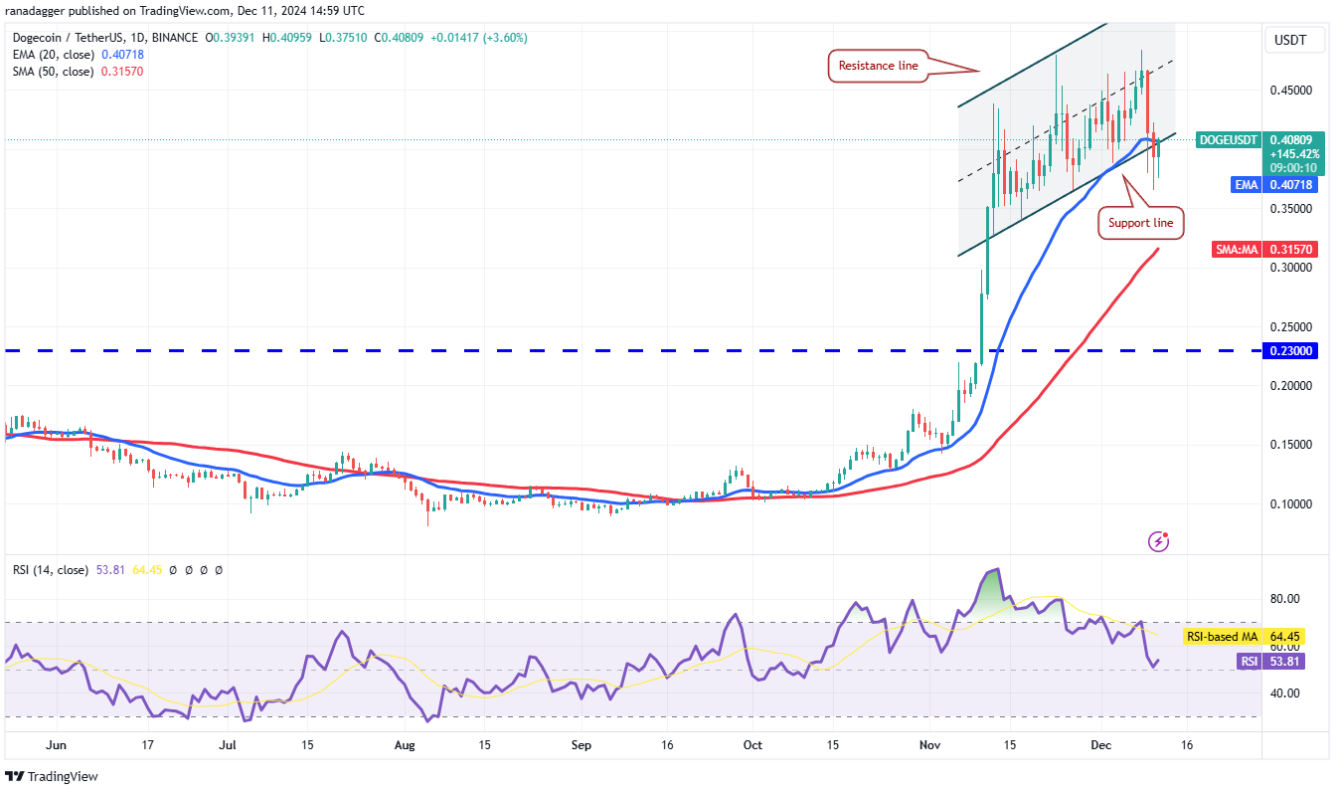
If the price drops and fails to hold at $0.36, the current bullish view will be rejected in the near term. This could lead to a deeper decline towards the 50-day simple moving average at $0.31, a crucial level that bullish investors need to defend to avoid further declines.
ADA Technical Analysis
Selling pressure picked up after Cardano (ADA) price fell below the nearest support at $1.11 on December 9. The ADA/USDT pair bounced from $0.91 on December 10, but this mild recovery is expected to face selling at the 61.8% Fibonacci retracement level of $1.16. If the price declines sharply from $1.16 and breaks below the 20-day EMA, this will indicate the formation of a range.
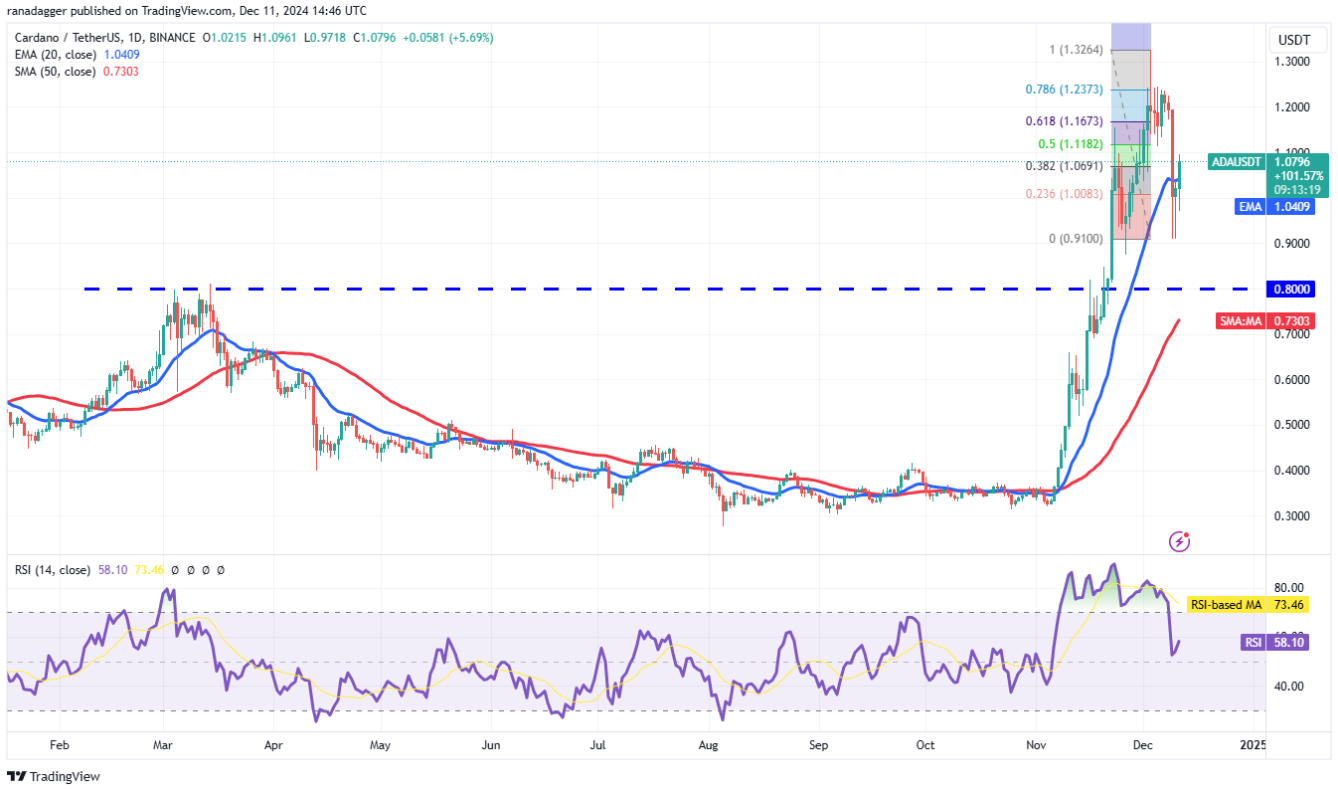
If the bulls can push the price above $1.16, the chances of a further rise to $1.24 and then $1.33 are much higher. However, if the bears gain the upper hand and they succeed in pushing the pair below the key support level of $0.90, it would indicate that they have regained control of the market.
AVAX Technical Analysis
Avalanche (AVAX) has undergone a sharp decline that has resulted in it falling below the 20-day EMA, hitting a low of $45.69 on December 9. However, the bears are currently struggling to hold these lows. On the contrary, the bulls have managed to push the price back above the 20-day EMA, which is a positive sign of the strength of the uptrend. If the buyers can sustain the price above the 20-day EMA, the AVAX/USDT pair is likely to rally towards the upper resistance zone between $51 and $56.
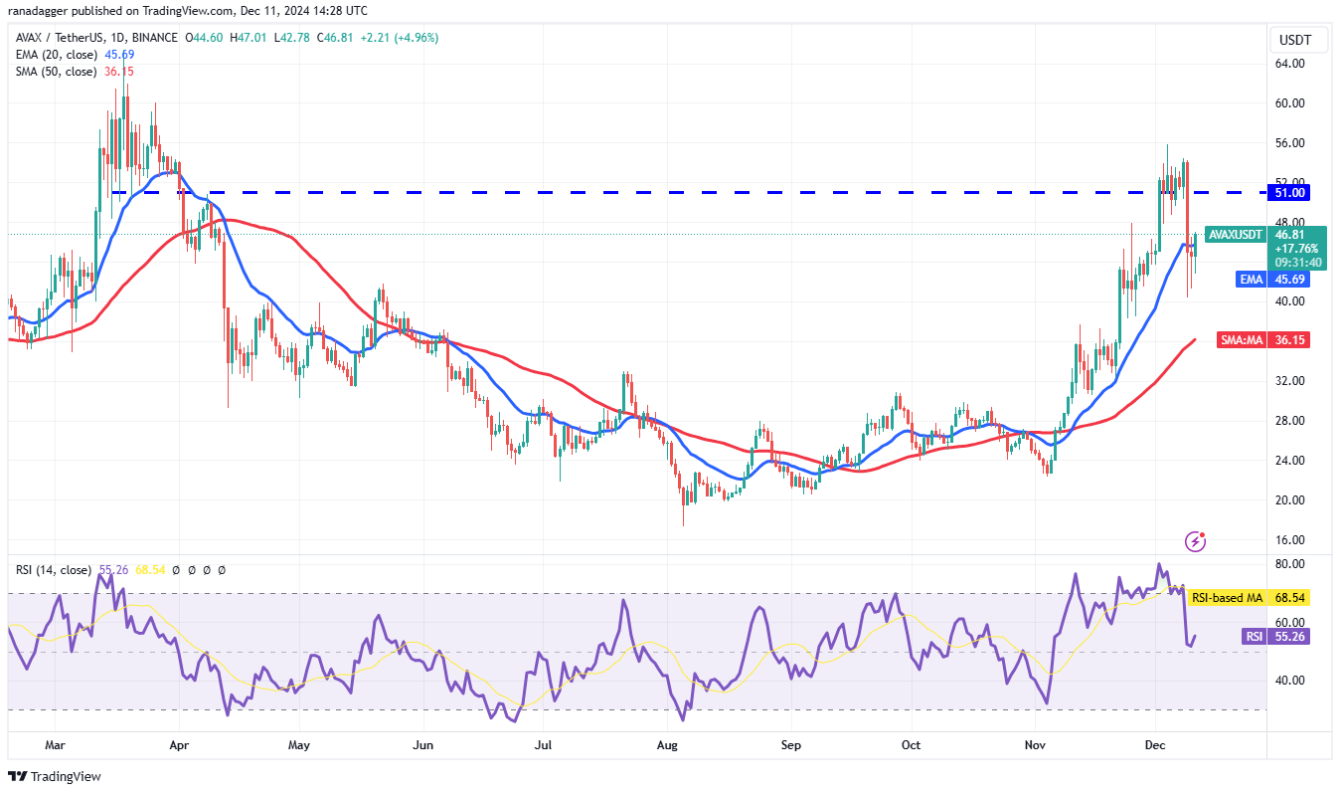
Conversely, if the price fails to sustain above the 20-day EMA, it will suggest that bears are selling on rallies. This increases the risk of a drop to the 50-day SMA ($36.15). Such a move will suggest that the breakout above $51 could be a bull trap.
TON Technical Analysis
Toncoin (TON) declined sharply on December 9 and dropped near the $4.72 to $4.44 support zone, which suggests profit booking by the bulls. The 20-day EMA ($6.28) has started to turn down and the RSI is near the midpoint, suggesting that bears have the upper hand. If the price turns down from the 20-day EMA, the possibility of a break below the 50-day SMA ($5.64) increases.
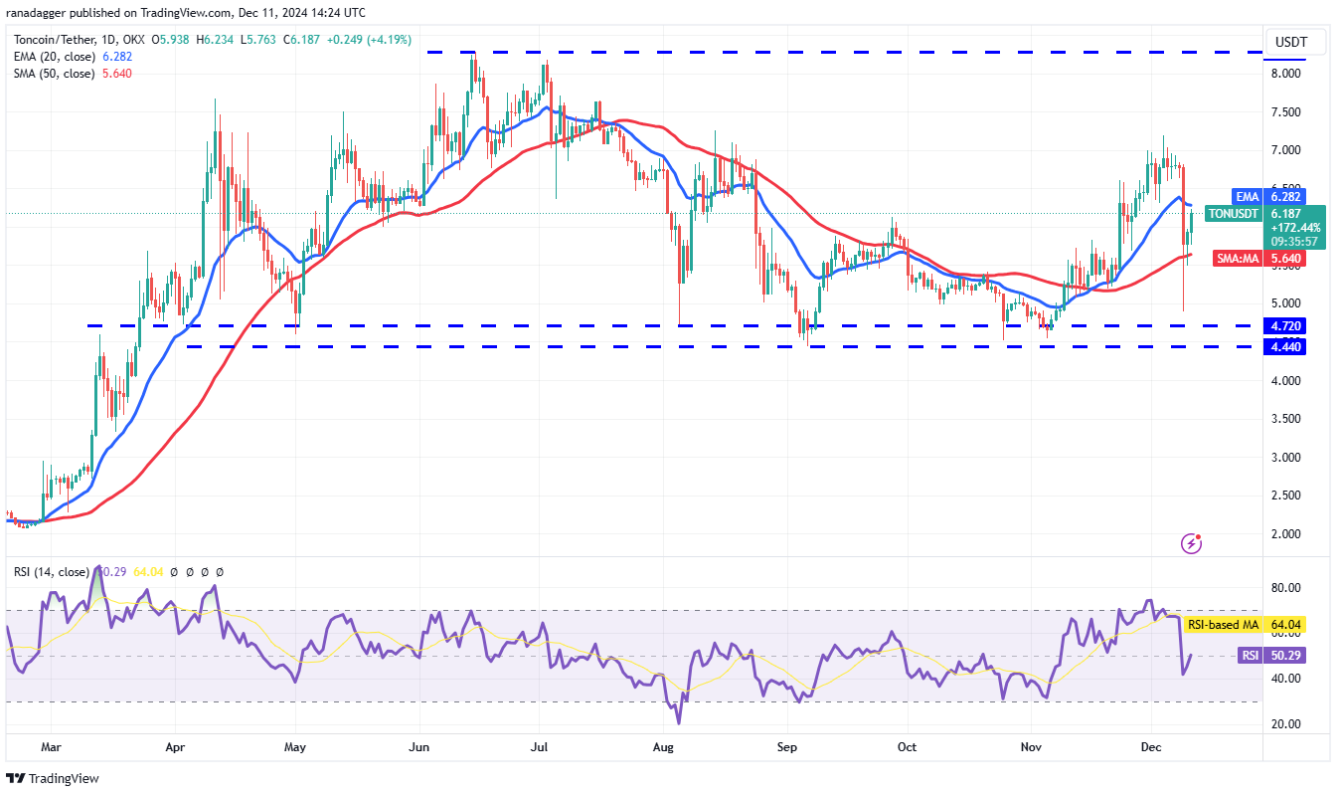
Conversely, if there is a breakout and the closing price crosses the 20-day EMA, this will indicate that there is strong demand at lower levels. The TON/USDT pair is likely to rise to $7.20, where bears (sellers) are likely to enter the market.
SHIB Technical Analysis
Shiba Inu (SHIB) declined from $0.000033 on December 8 and dipped below the 20-day EMA ($0.000028) on December 9.
The bulls are attempting to push the price back above the 20-day EMA but are likely to face stiff resistance from the bears. If the price turns down from the 20-day EMA, the bears will again attempt to sink the SHIB/USDT pair below the 50-day SMA. If that happens, the pair could drop to $0.000020.
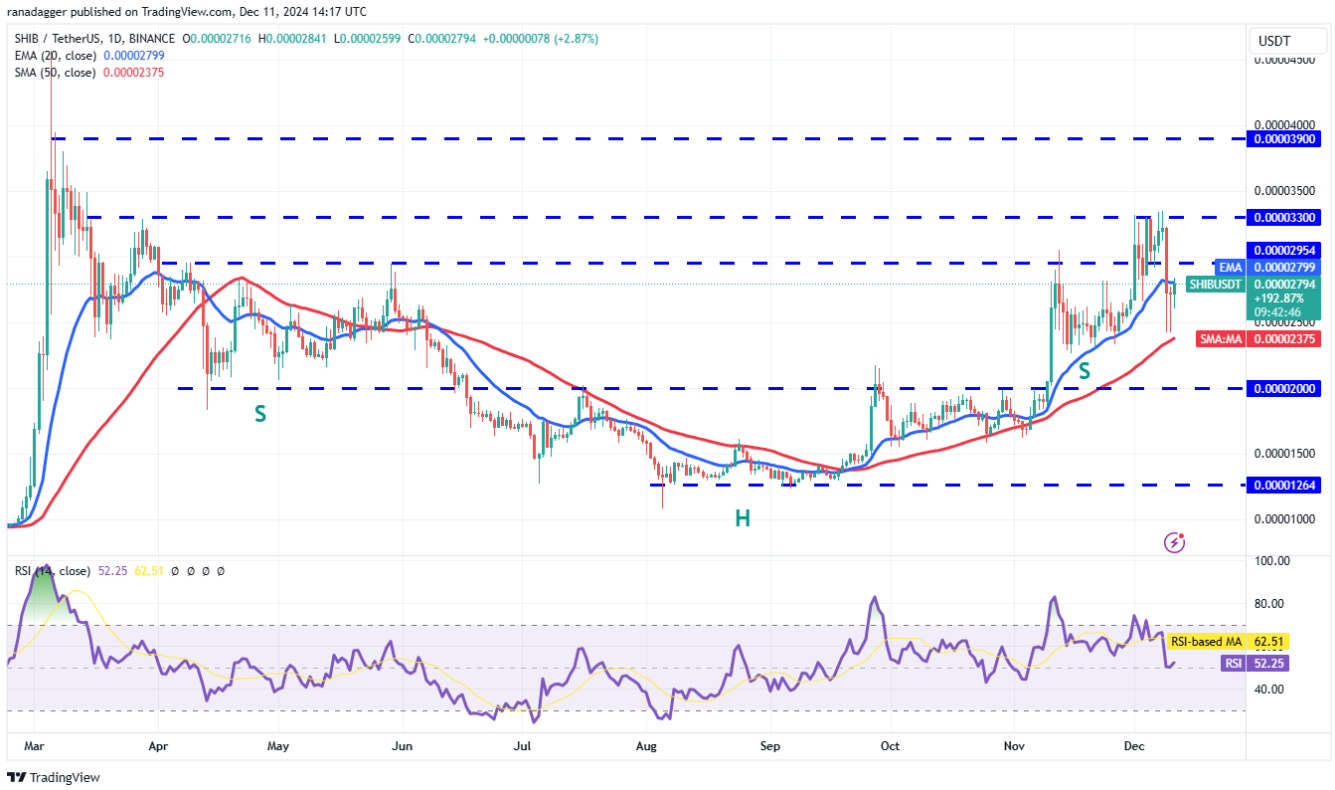
If the bulls want to halt the decline, they will have to quickly push the price back above $0.000028. After that, the pair could rise to $0.000033, which is expected to pose a serious challenge.
You can see coin price here.
This article is for informational purposes only and is not intended to provide specific investment advice. Therefore, investors should conduct their own research and study before making any investment decisions. Please note that we will not be responsible for any investment decisions you make.


