Multiple on-chain metrics for Ethereum (ETH) suggest a possible short-term price correction after the cryptocurrency surged 35% in the past 30 days. ETH recently hit $4,000, sparking concerns that it may be overbought.
As the price approaches this important resistance level, indicators suggest that selling pressure could increase, leading to a pullback before the uptrend resumes.
Ethereum (ETH) Sends Bearish Signal
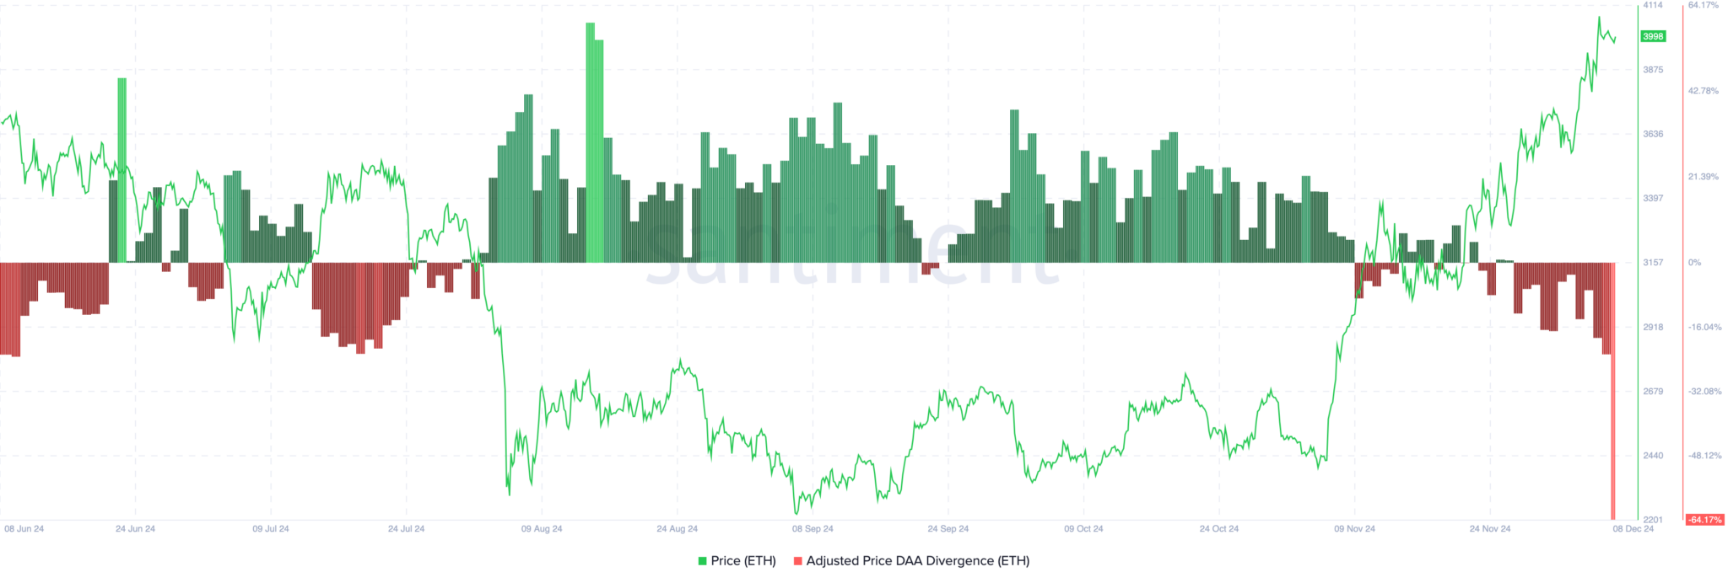
One of the leading on-chain metrics for Ethereum that suggests a potential decline is price-Daily Active Addresses (DAA) divergence. Simply put, this metric measures the degree of correlation between the cryptocurrency’s value and user engagement.

When this metric is positive, it indicates increased user engagement, creating room for the price to continue rising. Conversely, when this metric is negative, it signals decreased network activity, which could stall the upward trend.
According to data from Santiment, Ethereum’s price-DAA divergence has dropped to -64.17%. This sharp decline reflects a decrease in the number of addresses interacting with the coin. With such conditions, ETH prices may fall in the near future.
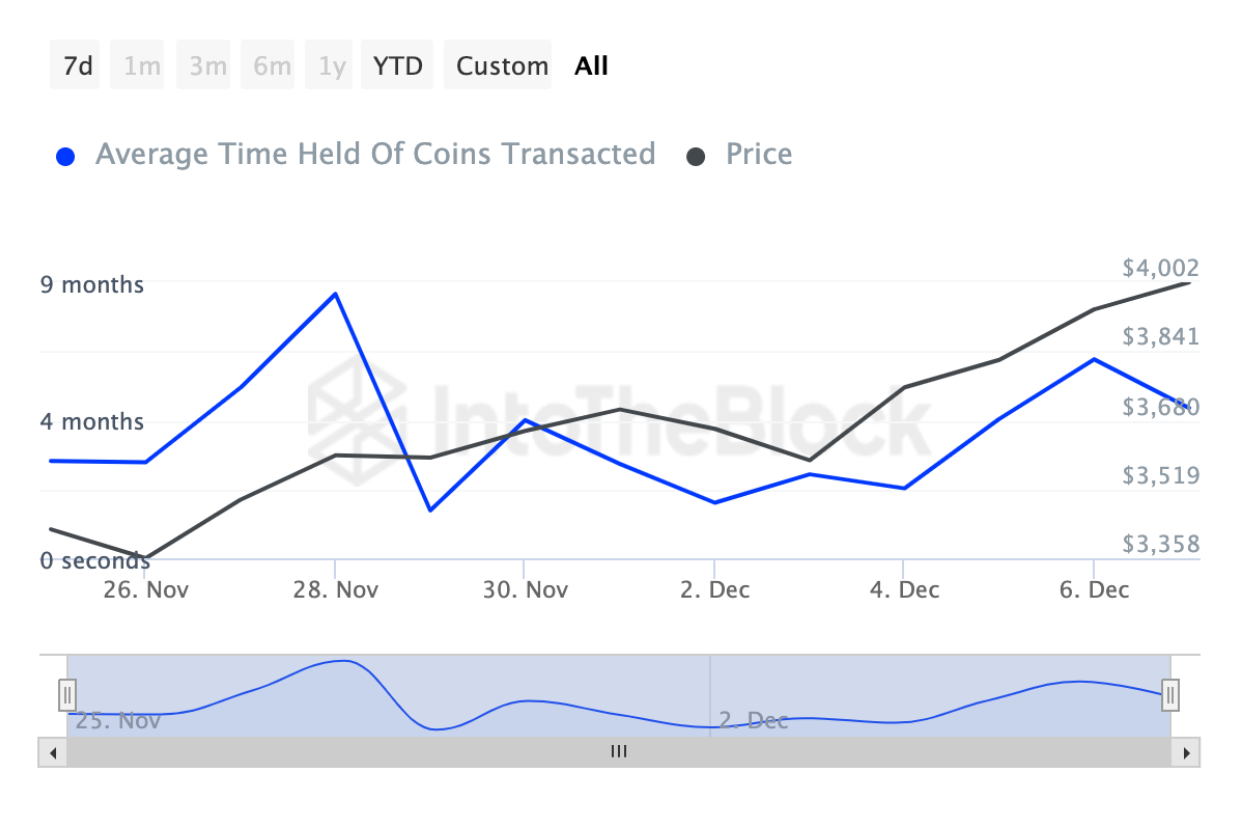
Additionally, recent analysis of the Coins’ Holding Time metric supports this view. This metric essentially measures the length of time a coin has been held without being traded or sold. When the metric increases, it implies that the majority of investors have chosen not to sell. Conversely, when the metric tends to decrease, it signals that selling pressure is increasing.

According to data from IntoTheBlock, Ethereum holding period has been decreasing since December 6. This shows that the coin is facing strong selling pressure. If this situation continues in the coming days, ETH price could fall below $3,900.
ETH Price Forecast: Back Below $3,800?
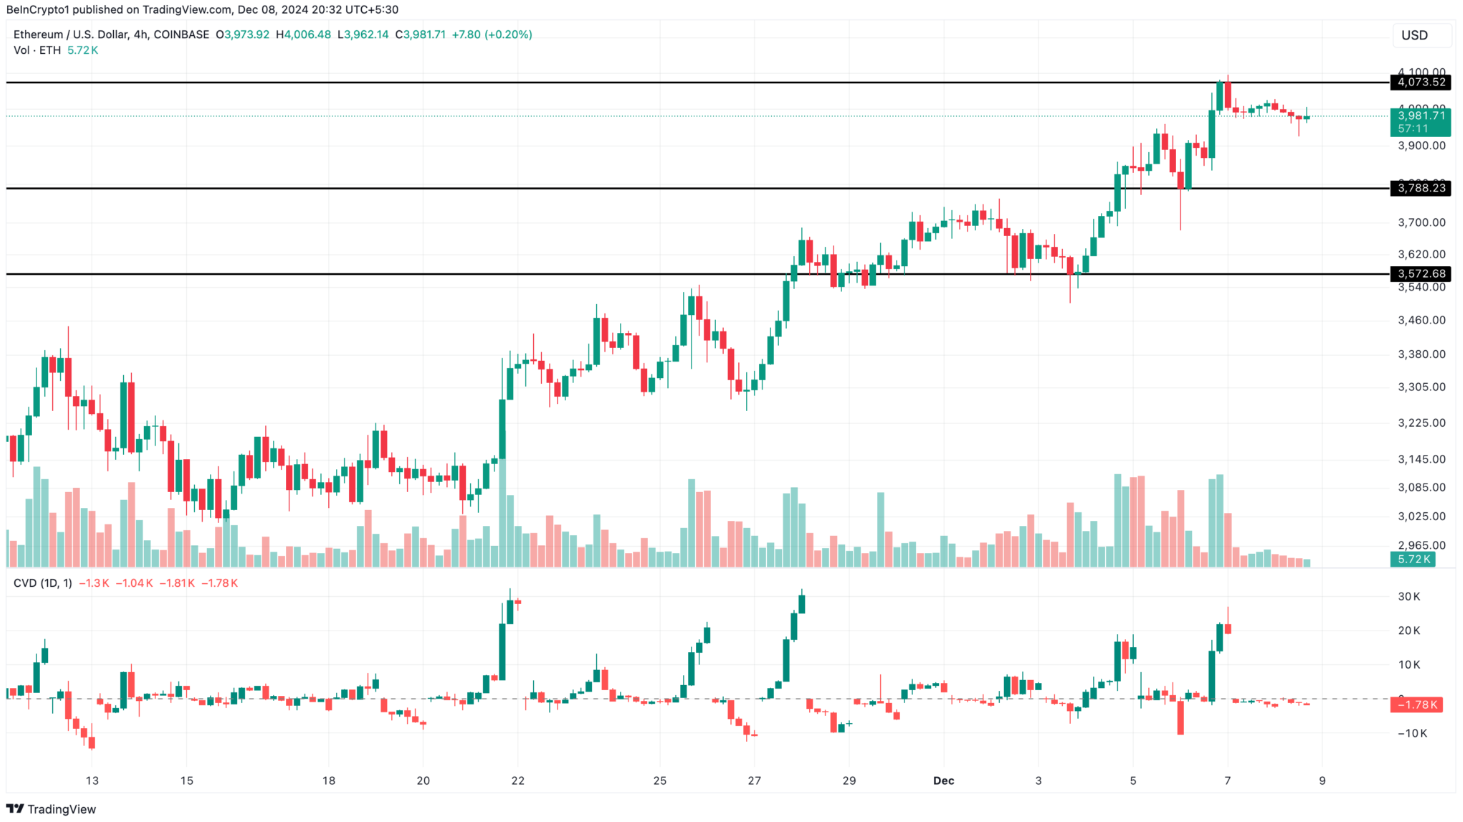
In the 4-hour time frame, the price of ETH faced a notable resistance at $4,073, resulting in a correction to $3,985. Furthermore, the Cumulative Volume Delta (CVD) indicator is currently in negative territory. CVD is a technical analysis tool that provides insight into the buying and selling pressure in the market. It measures the net difference between the buying and selling volume over a given period of time. When CVD is positive, it indicates that buying pressure is dominant. Conversely, when CVD turns negative, it reflects increased selling pressure, which is exactly what ETH is facing right now.

If this situation continues, there is a high possibility that Ethereum price will decline to $3,788. In the worst case scenario, the price could fall even further, reaching $3,572. However, if the market trend changes positively, these negative scenarios may not happen. Instead, there is a possibility that ETH can recover and grow again, surpassing the $4,500 mark.
This article is for informational purposes only and is not investment advice. Investors should do their own research before making any investment decisions. We are not responsible for your investment decisions.


