Bitcoin (BTC) is currently experiencing a tense tug-of-war between bulls and bears at the psychologically important $100,000 mark. Percival, a contributor to CryptoQuant, noted in a Quicktake blog post on December 6 that Bitcoin’s weekly strength is running out, suggesting a possible market correction and consolidation in the coming period.
However, short-term uncertainty and price volatility have not changed analysts’ long-term bullish view on Bitcoin. Quinten François, co-founder of WeRate, said on the X platform that Bitcoin is “entering a euphoria phase,” which could extend its rally for up to 12 months before reaching a cyclical peak.
Along with Bitcoin, Donald Trump’s victory in the US presidential election has boosted the prices of several altcoins. However, Felix Hartmann, managing partner at Hartmann Capital, warned on X that venture capital funds and development teams could aggressively take profits in altcoins, leading to a severe price drop. So, will select altcoins continue to outperform in the short term if Bitcoin enters an accumulation phase? Let’s take a look at the five cryptocurrencies with the strongest chart structures.
BTC Technical Analysis
Bitcoin is currently facing strong resistance near the psychologically important $100,000 level. However, bulls have shown no signs of wanting to exit the market anytime soon. The price is fluctuating in a narrow range near $100,000, further strengthening the possibility of a breakout in the near term. If buyers can push the price above $104,088, it will create a stronger upward momentum, taking the BTC/USDT pair towards $113,331 and then $125,000.
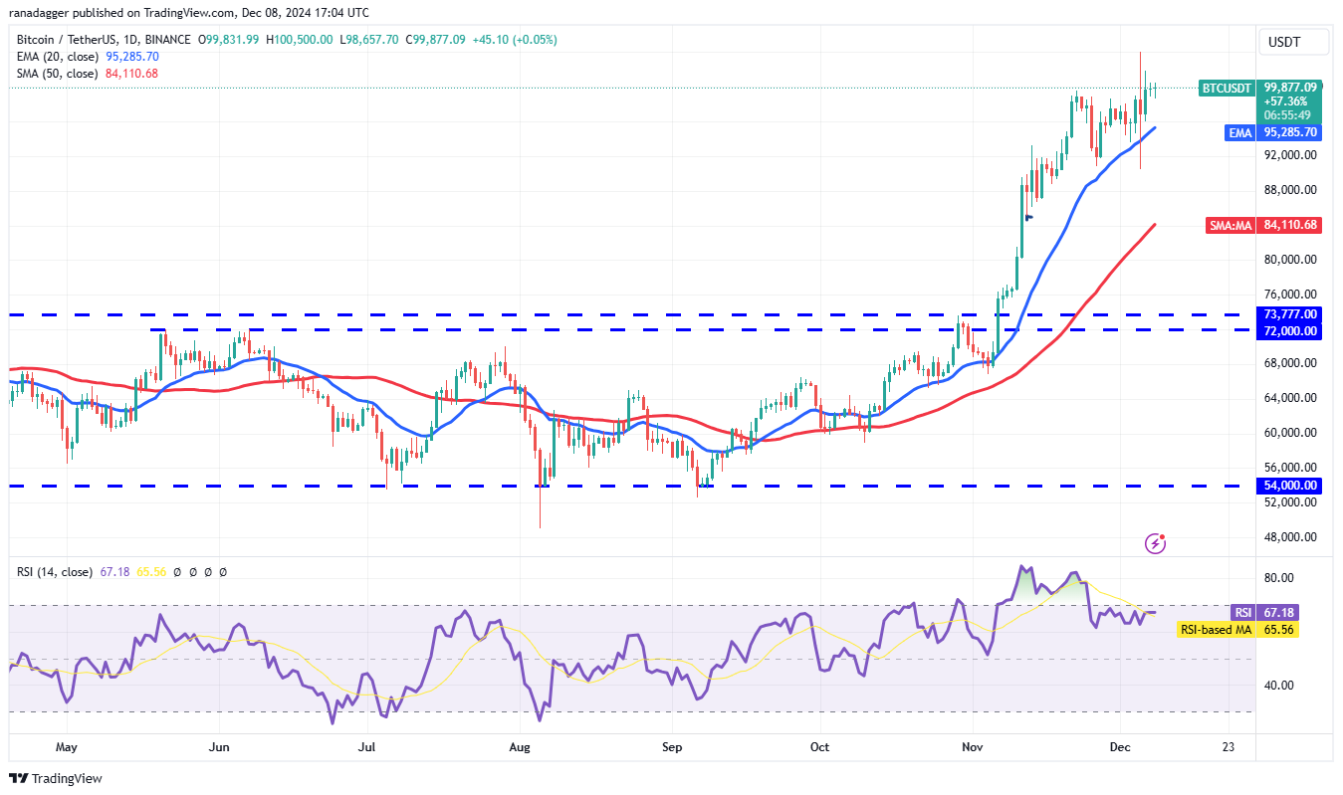
Additionally, one of the key support levels to watch in the short term is the 20-day exponential moving average (EMA), which is currently at $95,285. A breach of this level could indicate that the bulls are feeling pressure and are rushing to book profits. The price could then drop to around $90,000, before approaching the 50-day simple moving average (SMA) at $84,110.
Currently, the price is trading above the moving averages , suggesting that the bulls have a slight advantage. However, the rally could face strong resistance in the $101,900 to $104,088 zone. If the price breaks through this zone, the BTC/USDT pair could head towards $113,331.
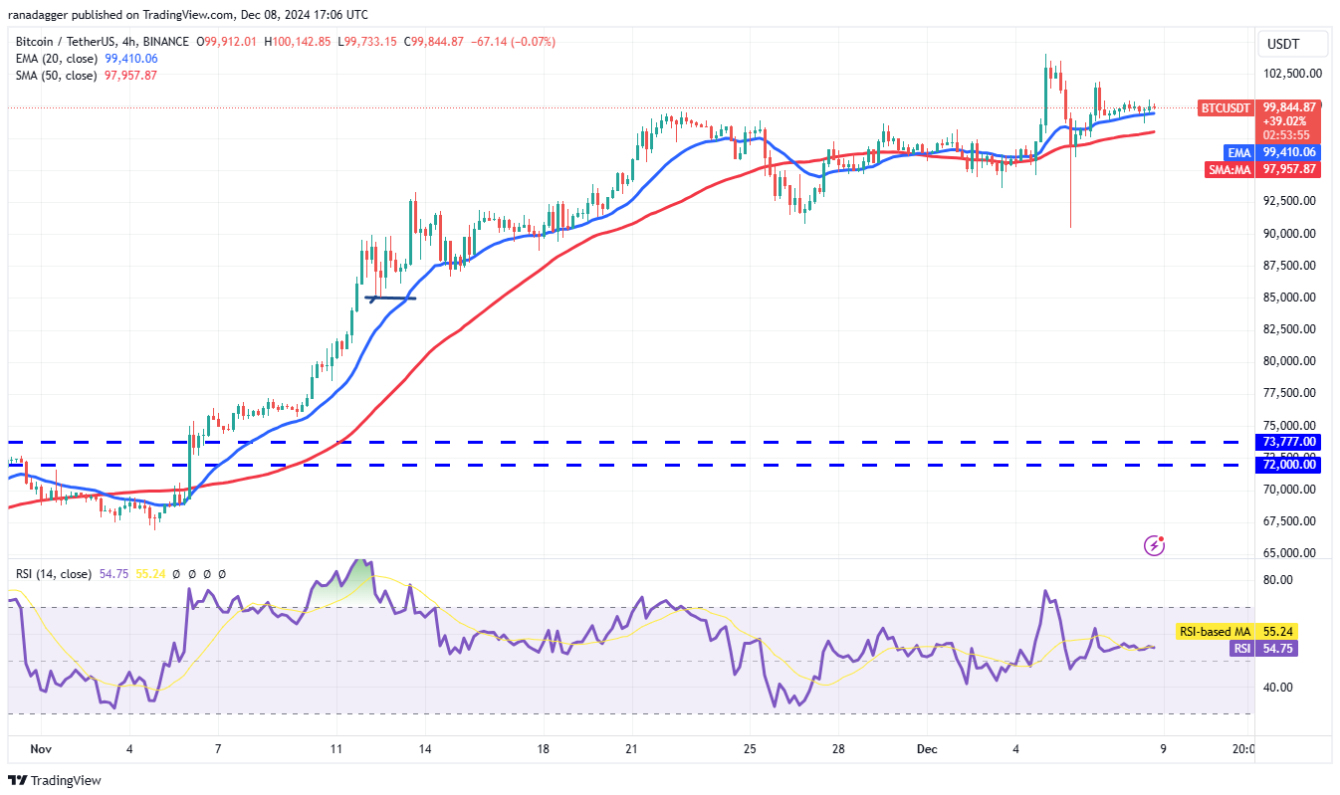
Conversely, if the price breaks and closes below the moving averages, short-term bulls are likely to book profits. This could drag the price down to $90,000, where it is expected to attract fresh buying. If the price recovers from $90,000 and breaks above the moving averages, it would indicate a possible range formation, with the BTC/USDT pair trading within the $90,000–$104,088 range for some time.
DOGE Technical Analysis
Dogecoin (DOGE) is rising within an ascending channel pattern, which shows that bulls have the upper hand.
The bulls attempted to push the price above the $0.48 resistance, but the bears held firm. If the price rises from the current levels or from the 20-day EMA at $0.41, the bulls will make another attempt to push the DOGE/USDT pair towards the resistance line of the channel. However, the bears are expected to defend this resistance line aggressively, as a break could send the DOGE/USDT pair soaring to $0.60.
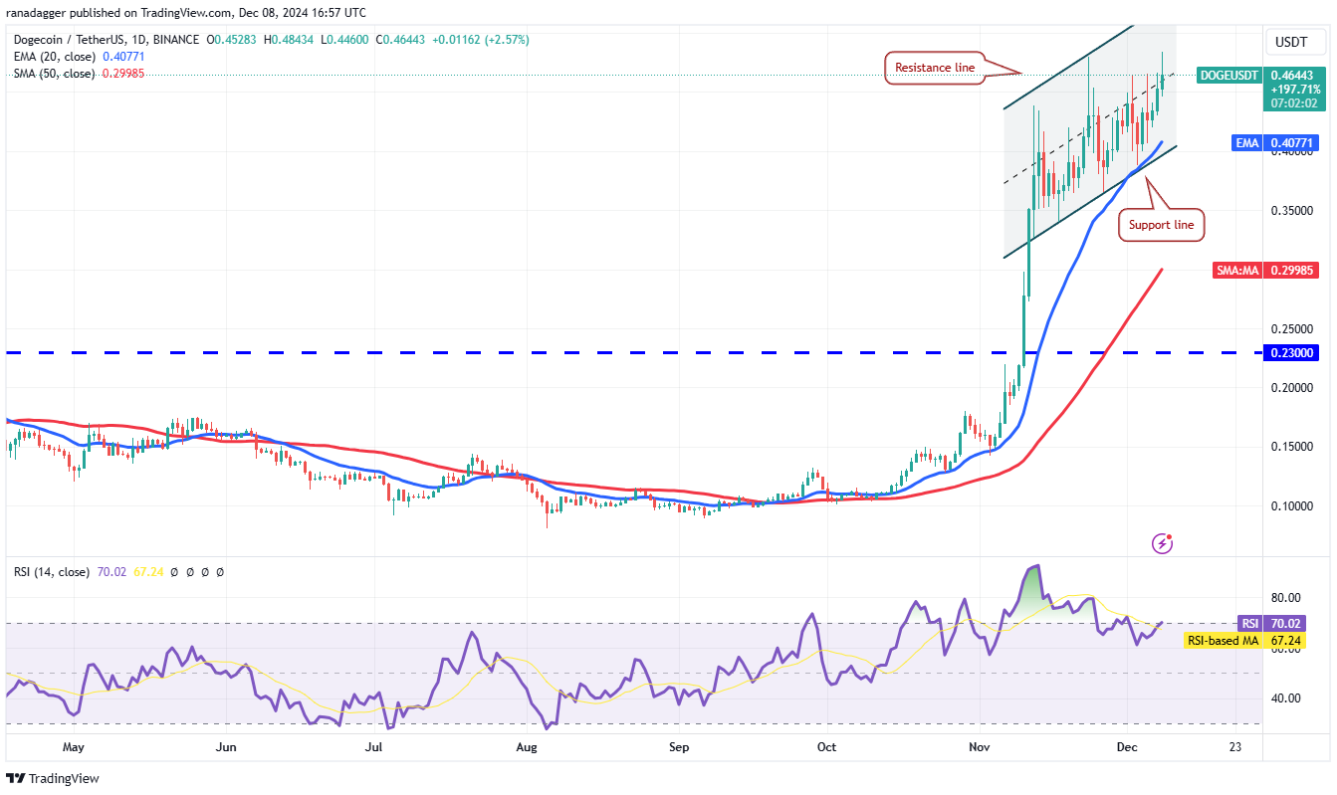
For the bears to halt the market’s upward momentum, they will need to pull the price below the support level of the trading channel. If this happens, the price could continue to decline towards the 50-day SMA at $0.30.
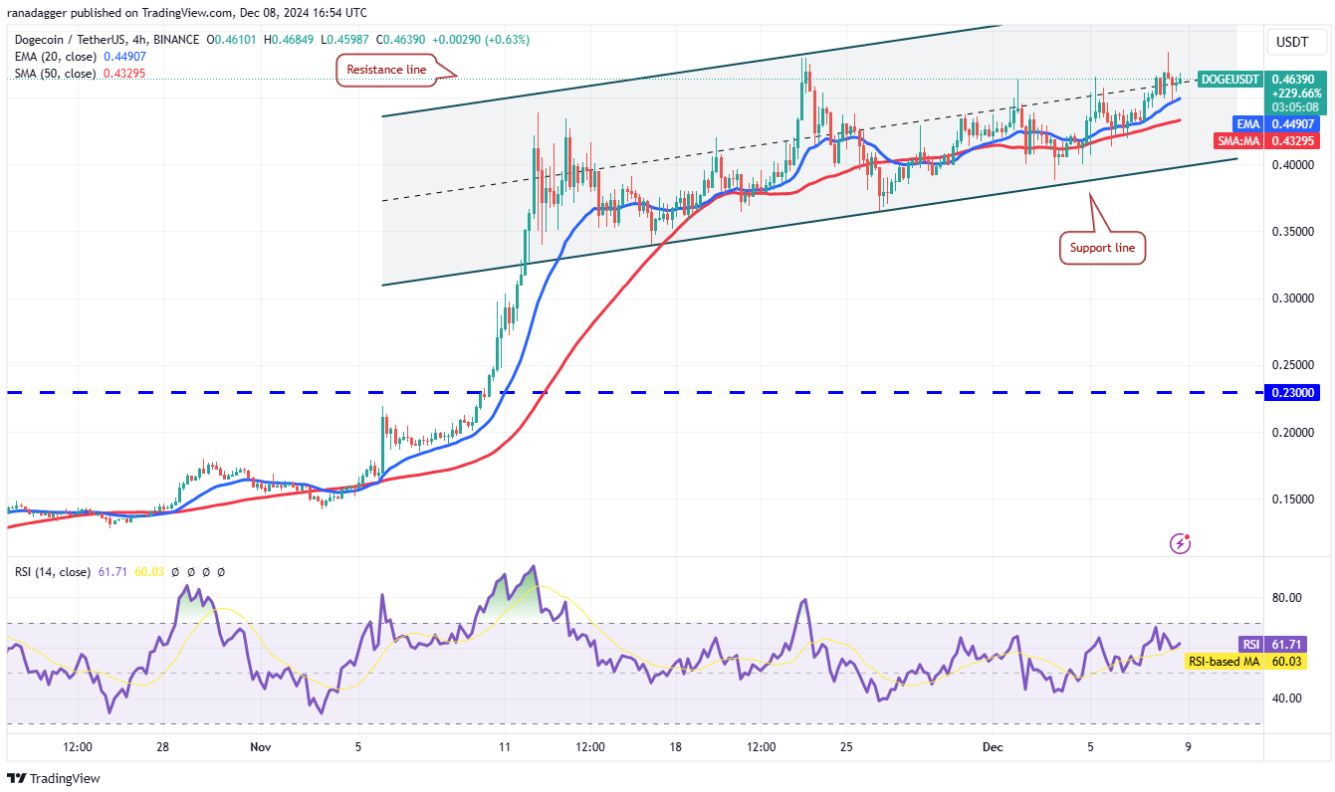
Currently, the price is receiving support from the 20 EMA, which shows that the market sentiment remains relatively positive. The bulls will continue to make efforts to break the resistance at $0.48. If they succeed, the price is likely to rise to the resistance level of the channel. However, if the price shows signs of a sharp decline from the resistance level and breaks the support level of the 20 EMA, the DOGE/USDT currency pair may continue to trade within this channel for a while longer.
SUI Technical Analysis
Sui (SUI) is facing resistance around the $4.50 value. However, despite the pressure from the bears, the bulls are holding their ground, which suggests that there are expectations for further growth in the near term.
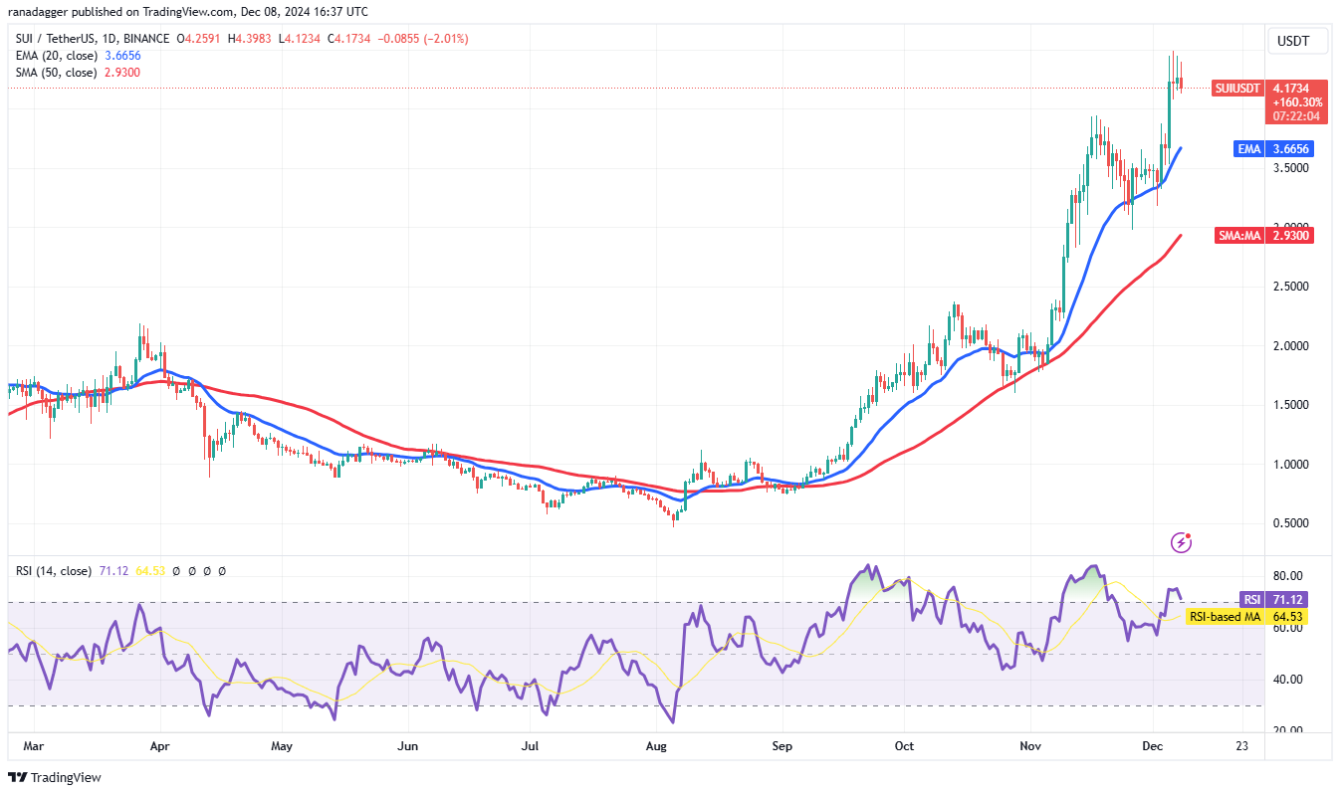
The SUI/USDT pair is likely to decline to $3.94, after which it will meet the 20-day EMA at $3.66. If the price starts recovering from the 20-day EMA, the bulls will likely attempt to overcome the resistance at $4.50. In case they succeed, the SUI/USDT pair is likely to enter a new rally that could take the price to $5.31.
However, one thing to note is that the RSI is showing signs of a negative divergence . If the price suddenly breaks below the 20-day EMA, this could indicate that the bulls are taking profits, leading to a possible drop to the 50-day SMA at $2.93.
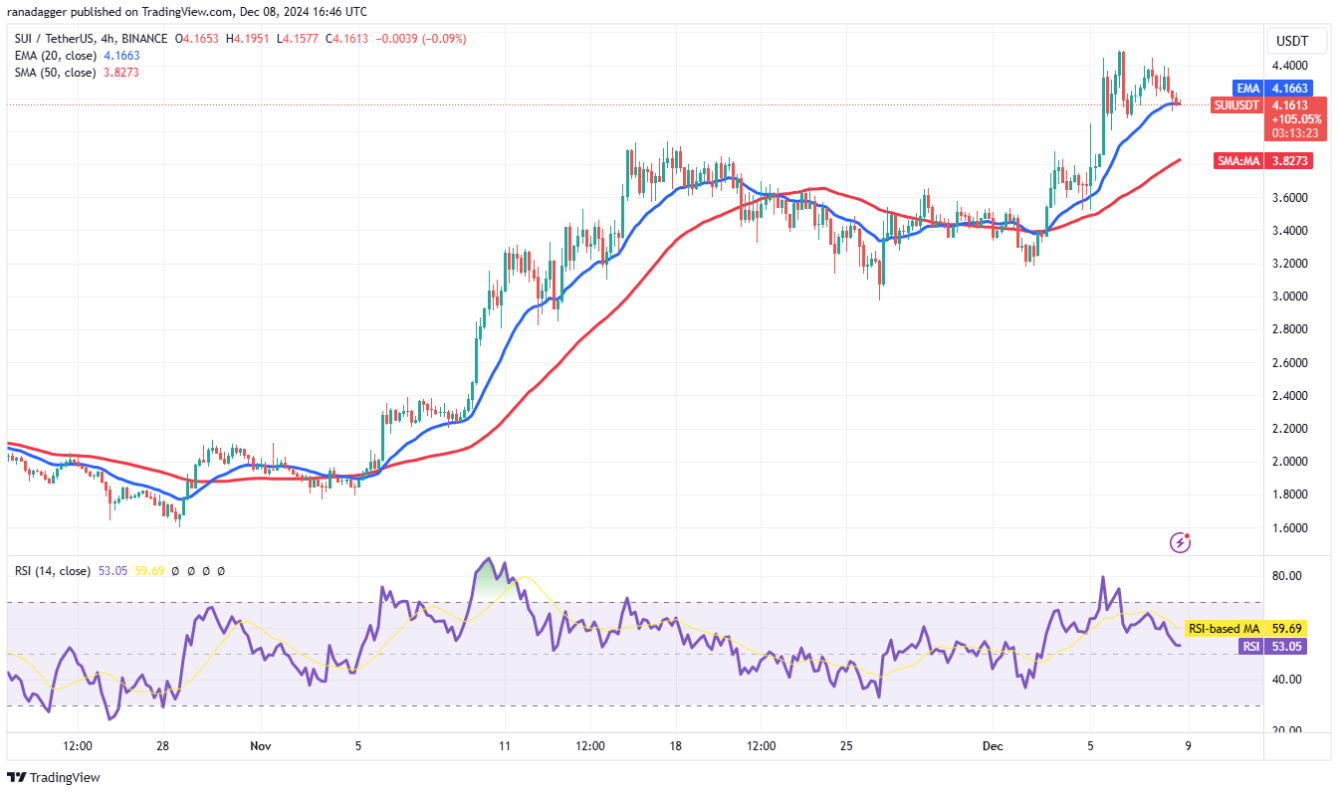
Failure to break above $4.50 could see the token fall to $4. This is an important support level to watch, as a strong bounce from this level would increase the chances of the token rising back above $4.50. Conversely, if the price breaks and closes below $4, it would indicate that bears are regaining control. The price could then fall to the 50-SMA. If this support level is also broken, the token could plunge to $3.
PEPE Technical Analysis
Currently, the PEPE price ($0.00002668) has hit the resistance level of $0.000027, where the bulls and bears are fiercely fighting for control.
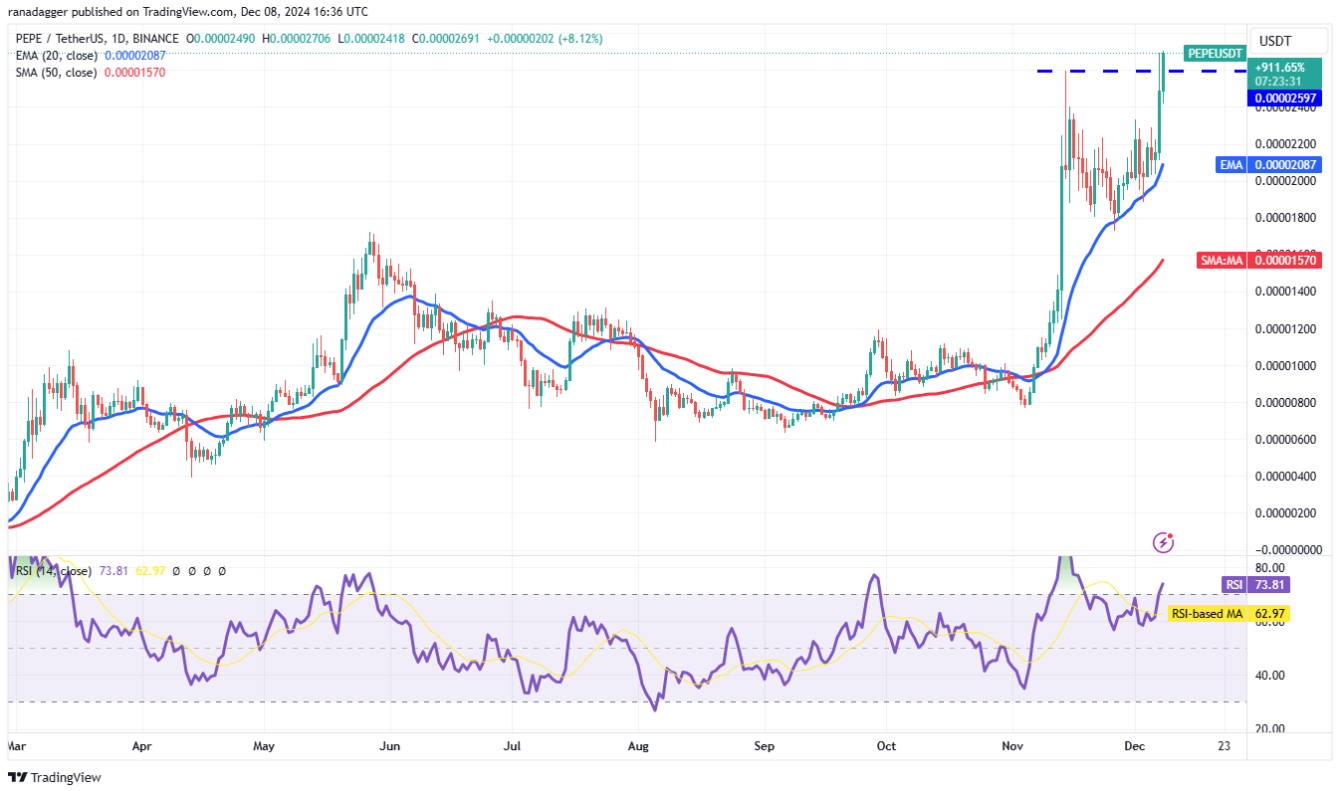
The 20-day EMA is currently at $0.000021 and is trending up, while the RSI is in the overbought zone. This suggests that the advantage is currently with the bullish investors (bulls). If the bulls continue to sustain the price above $0.000027, the PEPE/USDT pair is likely to rise to $0.000035, and if the situation is favorable, it could continue to advance to $0.000044.
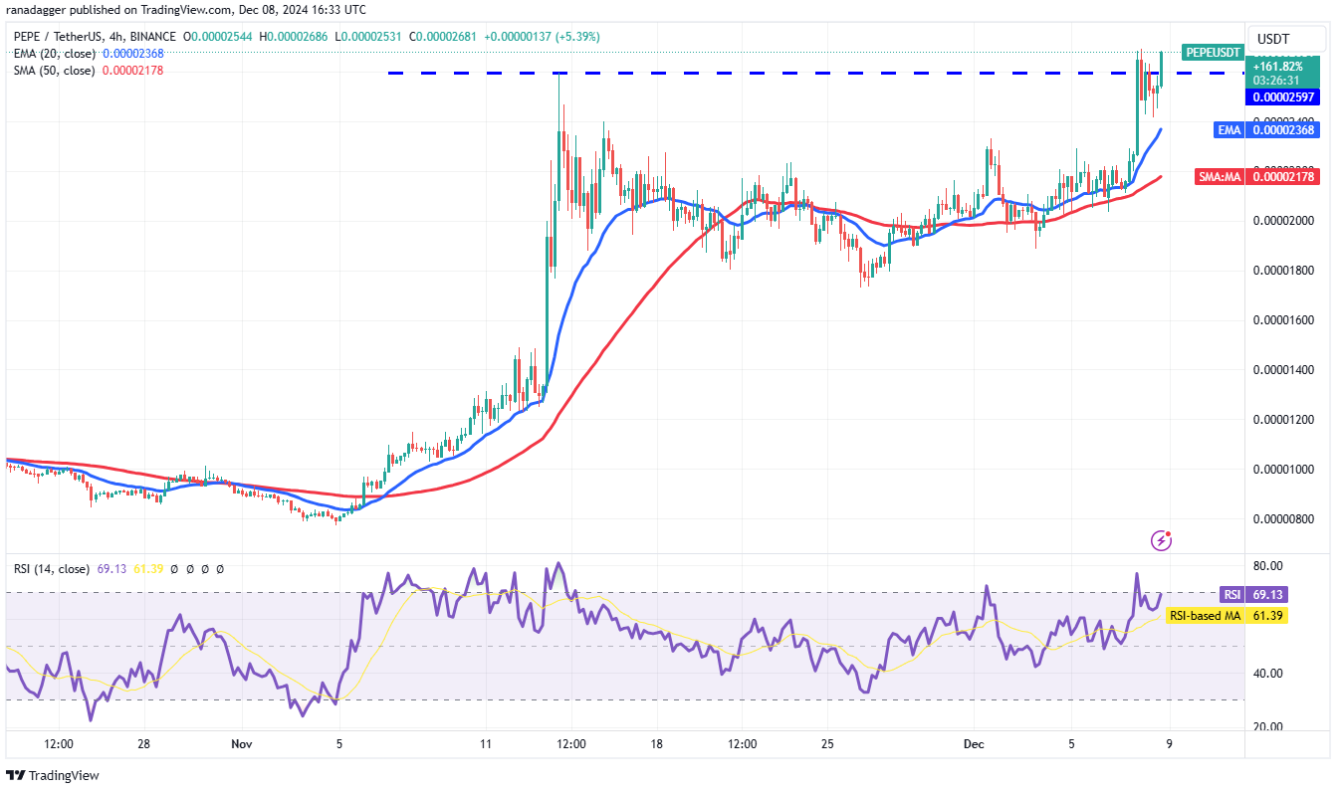
However, if the price stalls and reverses from $0.000027, it would indicate that the bears are aggressively defending this resistance level. We could then see the price fall back to the 20-day EMA. In order to regain the upper hand, the bears would need to push the price below the 20-day EMA.
The price recently dipped below $0.000024, but the bulls took the opportunity to buy when the price touched the 20-day EMA. Currently, the bulls continue to push the price above $0.000027. If successful, the price could rally sharply to $0.000035. On the other hand, if the bears want to counterattack, they need to quickly pull the price below the moving averages. In that case, the pair could fall to the strong support near $0.000017.
FTM Technical Analysis
Currently, the Fantom price ($1.31) has broken above the $1.23 resistance on December 2. The bulls have successfully fended off the bears’ attempts to pull the price below this breakout level, indicating strong buying on minor dips.
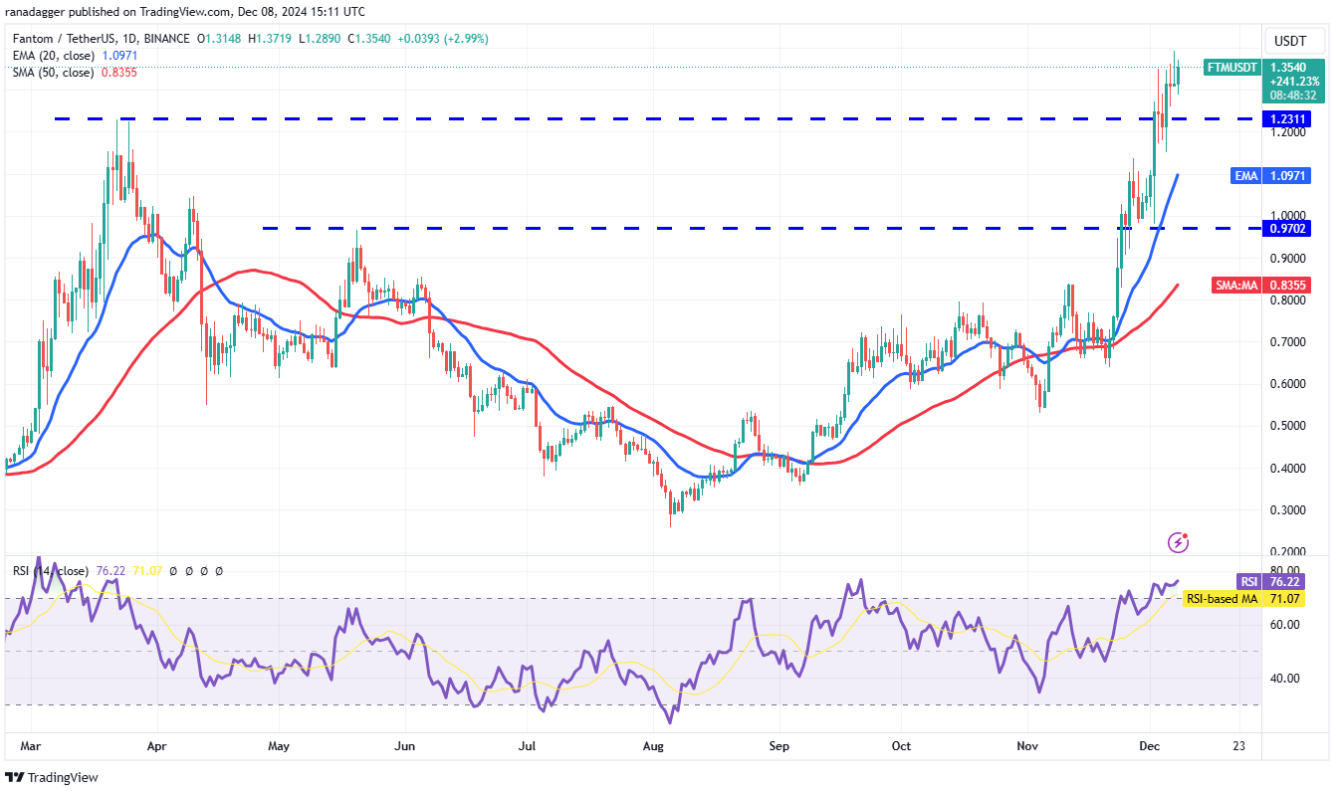
The rising 20-day EMA ($1.09) and the RSI in the overbought zone suggest that the bulls have the upper hand. The next target for the bulls is a push to $1.68, where they could face stiff resistance. A breakout above this level could see the price continue to rise to $2.
The key support level to watch on the downside is $1.23. If the price breaks and closes below this level, it will indicate that the bullish momentum is weakening. The FTM/USDT pair could then drop to the 20-day EMA.
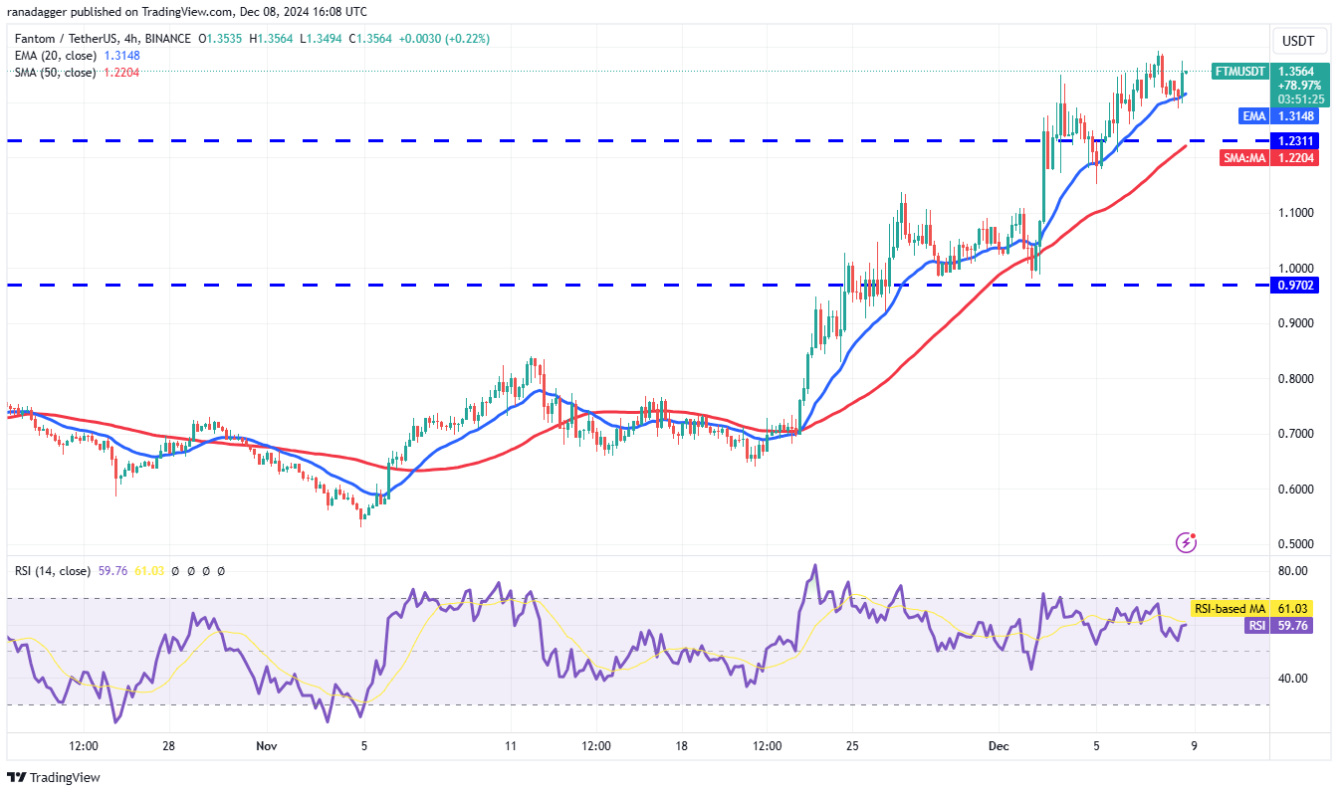
Currently, the price has bounced off the 20-EMA, which shows that the bulls are buying aggressively on minor corrections. If the price breaks above $1.39, the pair could resume its uptrend with the next target at $1.68.
Conversely, if the price declines sharply from $1.39 and breaks the 20-EMA, it will indicate that bears are active at higher levels. The price could then drop to the 50-SMA. If this support level is broken, the short-term advantage will tilt to the bears.
You can see coin price here.
This article is for informational purposes only and is not investment advice. Investors should do their own research before making any investment decisions. We are not responsible for your investment decisions.


