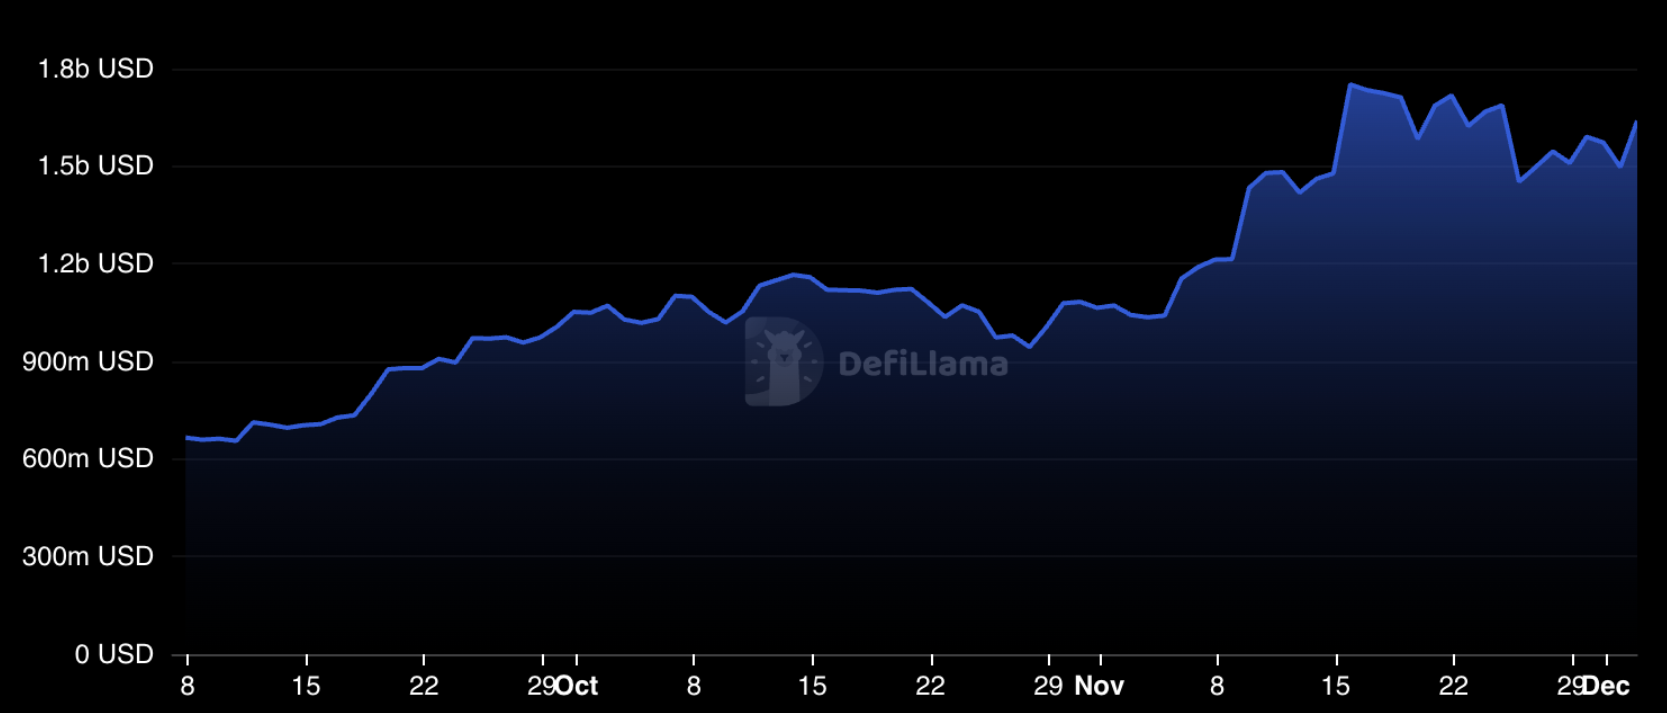
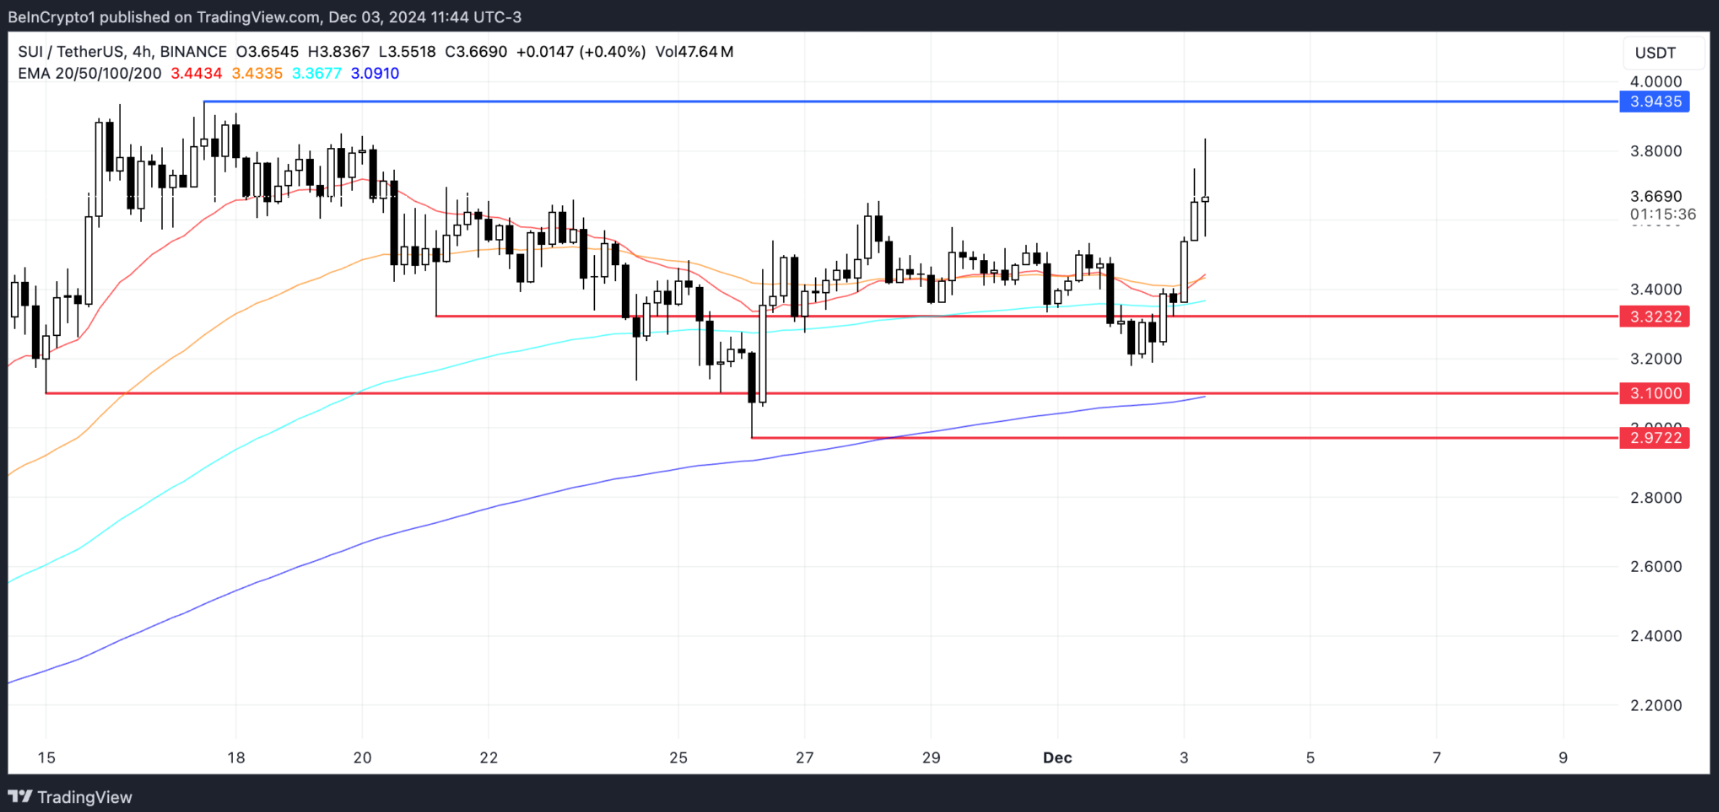
Sui (SUI) price is showing mixed signals after its meteoric rise, currently trading 6.5% below its all-time high. The coin has recorded an impressive 97.10% increase in the past 30 days, supported by the strong growth of the DeFi ecosystem, with a total value locked (TVL) of $1.75 billion.
SUI price may rise to highest
While indicators like BBTrend are suggesting that we should be cautious in the short term, the solid alignment of the EMAs and the Total Value Locked (TVL) level remaining above $1.4 billion indicate the underlying strength in SUI’s market structure. Currently, the altcoin is facing a critical threshold at $3.94. If the bulls continue to hold their ground in the market, it is likely to reach new highs above $4.00.
SUI’s TVL stable above $1.4 billion
The total value locked on the SUI blockchain has increased from $665 million to $1.75 billion in just nine days. This significant increase reflects strong investor confidence and growing adoption of the SUI ecosystem, as users lock more assets into smart contracts for staking, lending, and liquidity provision.

Currently, the total value locked (TVL) is hovering around $1.45 billion, and recently peaked at $1.64 billion. This shows that its growth is not only speculative but also very sustainable. In fact, when TVL is high and stable, there is often a strong correlation with price pressure. This increase occurs due to locked assets, thereby reducing the circulating supply on the market, while increasing the utility value of the network.
If the platform continues to see heavy usage and liquidity continues to decrease, then the price of SUI is likely to continue to maintain its upward momentum if the current TVL level remains stable.
BBTrend Turns Negative After 4 Days
SUI’s BBTrend (Bollinger Band trend) indicator has just turned negative and is approaching -1, signaling a significant change in market momentum.
BBTrend measures price volatility and trend direction by analyzing how price moves relative to the Bollinger Bands . Positive values indicate bullish pressure, while negative values suggest bearish pressure.

The move from positive to near -1 indicates that the SUI price is moving down to the lower Bollinger Band, signaling increased selling pressure. This is a technical warning signal, which could lead to a short-term price correction as traders often view BBTrend turning negative as a sell signal.
However, extreme negative levels can also indicate oversold conditions, which are sometimes a precursor to price rallies as selling pressure dries up.
SUI Price Prediction: Next Target $4?
Currently, SUI price is showing a strong bullish momentum, as the EMAs (exponential moving averages) are aligned in a positive direction, giving hope to investors.
It can be seen that the current price has significant upside potential, with the immediate targets including the previous ATH at $3.94 and the important psychological resistance at $4.00. If achieved, this would set a new record high for SUI.

However, it is essential to hold key support levels to maintain this uptrend. In case of a bearish reversal, SUI’s price may have to retest the support levels at $3.32 and $3.10 respectively, while $2.97 is the most important floor that everyone should pay attention to.
A break below these support levels could lead to increased selling pressure, although the current EMA structure still suggests that the bulls are in control of the market.
This article is for informational purposes only and does not constitute formal investment advice. Investors are advised to conduct thorough research and investigation before making any investment decisions. We are not responsible for any investment decisions you make. Please exercise due diligence and caution in all your investment choices.


